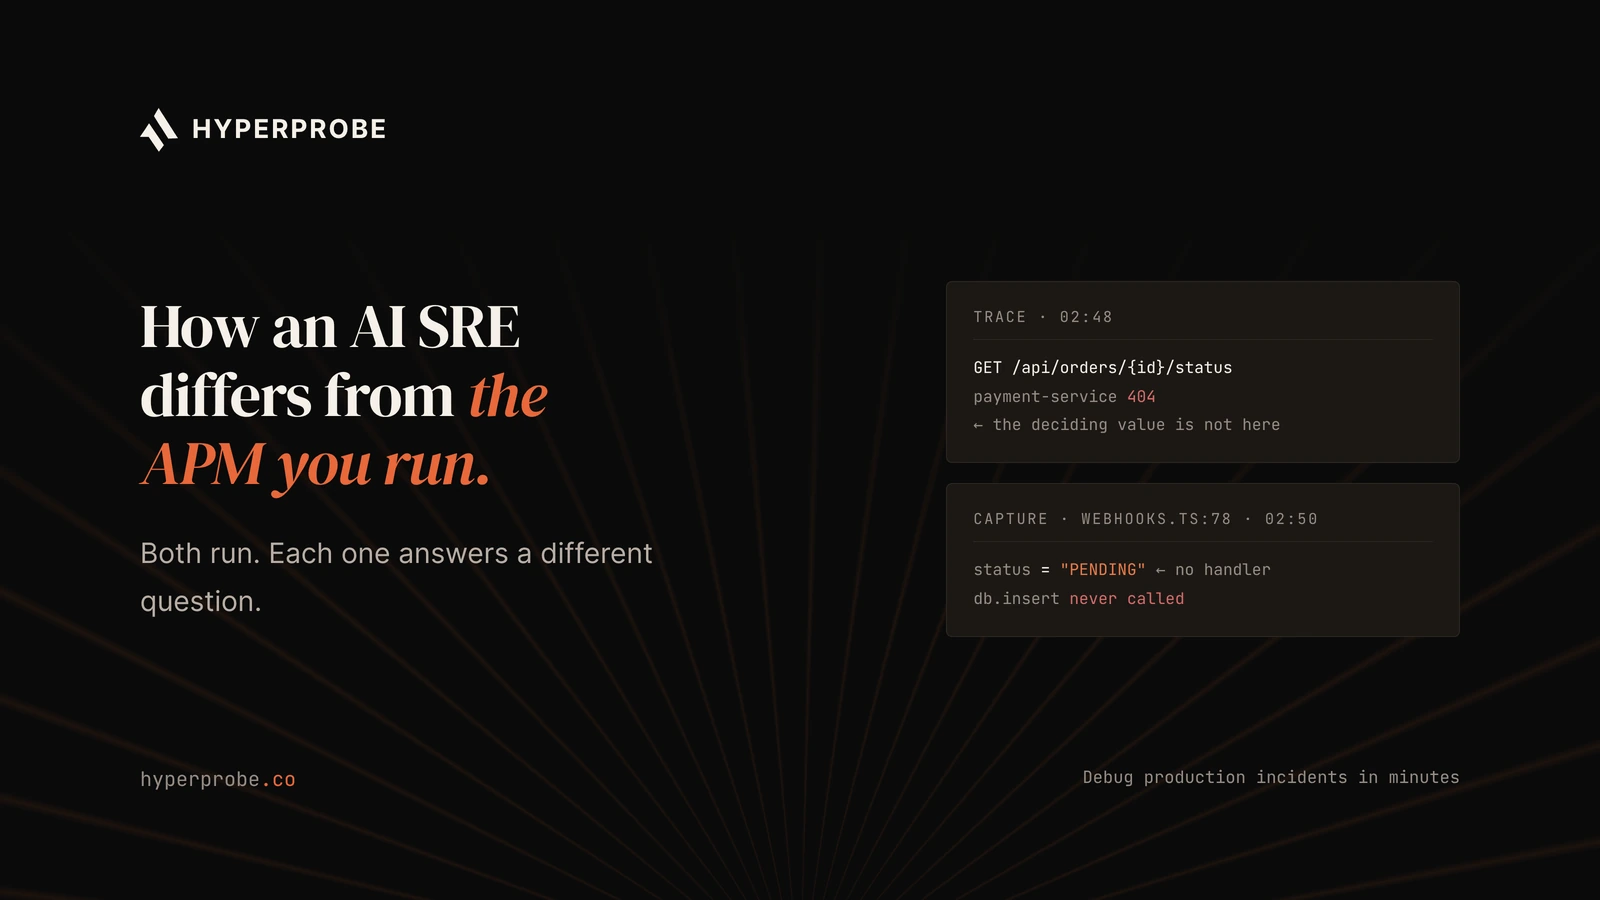
AI SRE vs APM is a question about two different purchases. Application performance monitoring (APM) collects telemetry chosen in advance and shows what happened across a system. An AI SRE investigation layer comes in after the alert and tries to explain one specific failure, often by pulling in new evidence from the running service.
For teams comparing AI SRE tools, that line between “watch everything” and “investigate this one thing” matters more. Application performance monitoring shows where latency, errors, and pressure appear. An AI SRE tool focuses on shortening the work that starts once the alert fires and someone has to find the actual cause.
What does APM show
APM shows how instrumented requests behave over time and where they degrade. It works by collecting telemetry such as metrics, logs, traces, and service metadata, then tying that data back to specific services and routes.
Distributed tracing follows a single request as it moves across processes and services. A trace is the full path of that request. Each span represents a unit of work on that path, for example an HTTP handler, a database call, or a queue consumer. Standards such as OpenTelemetry define what a span contains and how trace context is propagated across calls, so you can see how one service leads to another.
This structure makes APM strong at answering where time is spent, which downstream call slowed down, which route returns errors, and where resource pressure shows up in areas such as garbage collection or thread pools. It gives broad observability across the request path and is often the fastest way to move from a system-wide symptom to a specific service or code path to investigate.
AI SRE vs APM
The difference between an AI SRE and APM is where the evidence behind the conclusion comes from.
APM works from telemetry the customer already collected. Whereas, AI SRE captures new evidence from the running service. The question worth putting to any tool in this category is whether its mechanism can surface evidence that is missing today, or only reorganize evidence that already exists.
The table below compares APM and distributed tracing with AI SRE, an investigation layer that captures new evidence from the running service.
| Attribute |
APM and distributed tracing |
AI SRE |
| What it collects |
Continuous metrics, logs, traces, and service metadata |
Existing logs and traces first, then new evidence from the running service |
| When collection is decided |
Before the incident, through prior instrumentation and retention rules |
During the incident, only where prior data does not explain the failure |
| Main question answered |
What happened across the system |
What state was present at the exact line where the request executed |
| Unit of evidence |
Trends, traces, spans, and log events |
A capture from one request at one line |
| Where it stops |
Missing fields, sampling gaps, and uninstrumented branches |
Outside the running service code boundary |
| What it costs to run |
Ongoing telemetry ingestion and storage |
On-demand captures on a single service |
HyperProbe captures evidence from the running service rather than inferring a cause from data already collected.
Where does telemetry stop
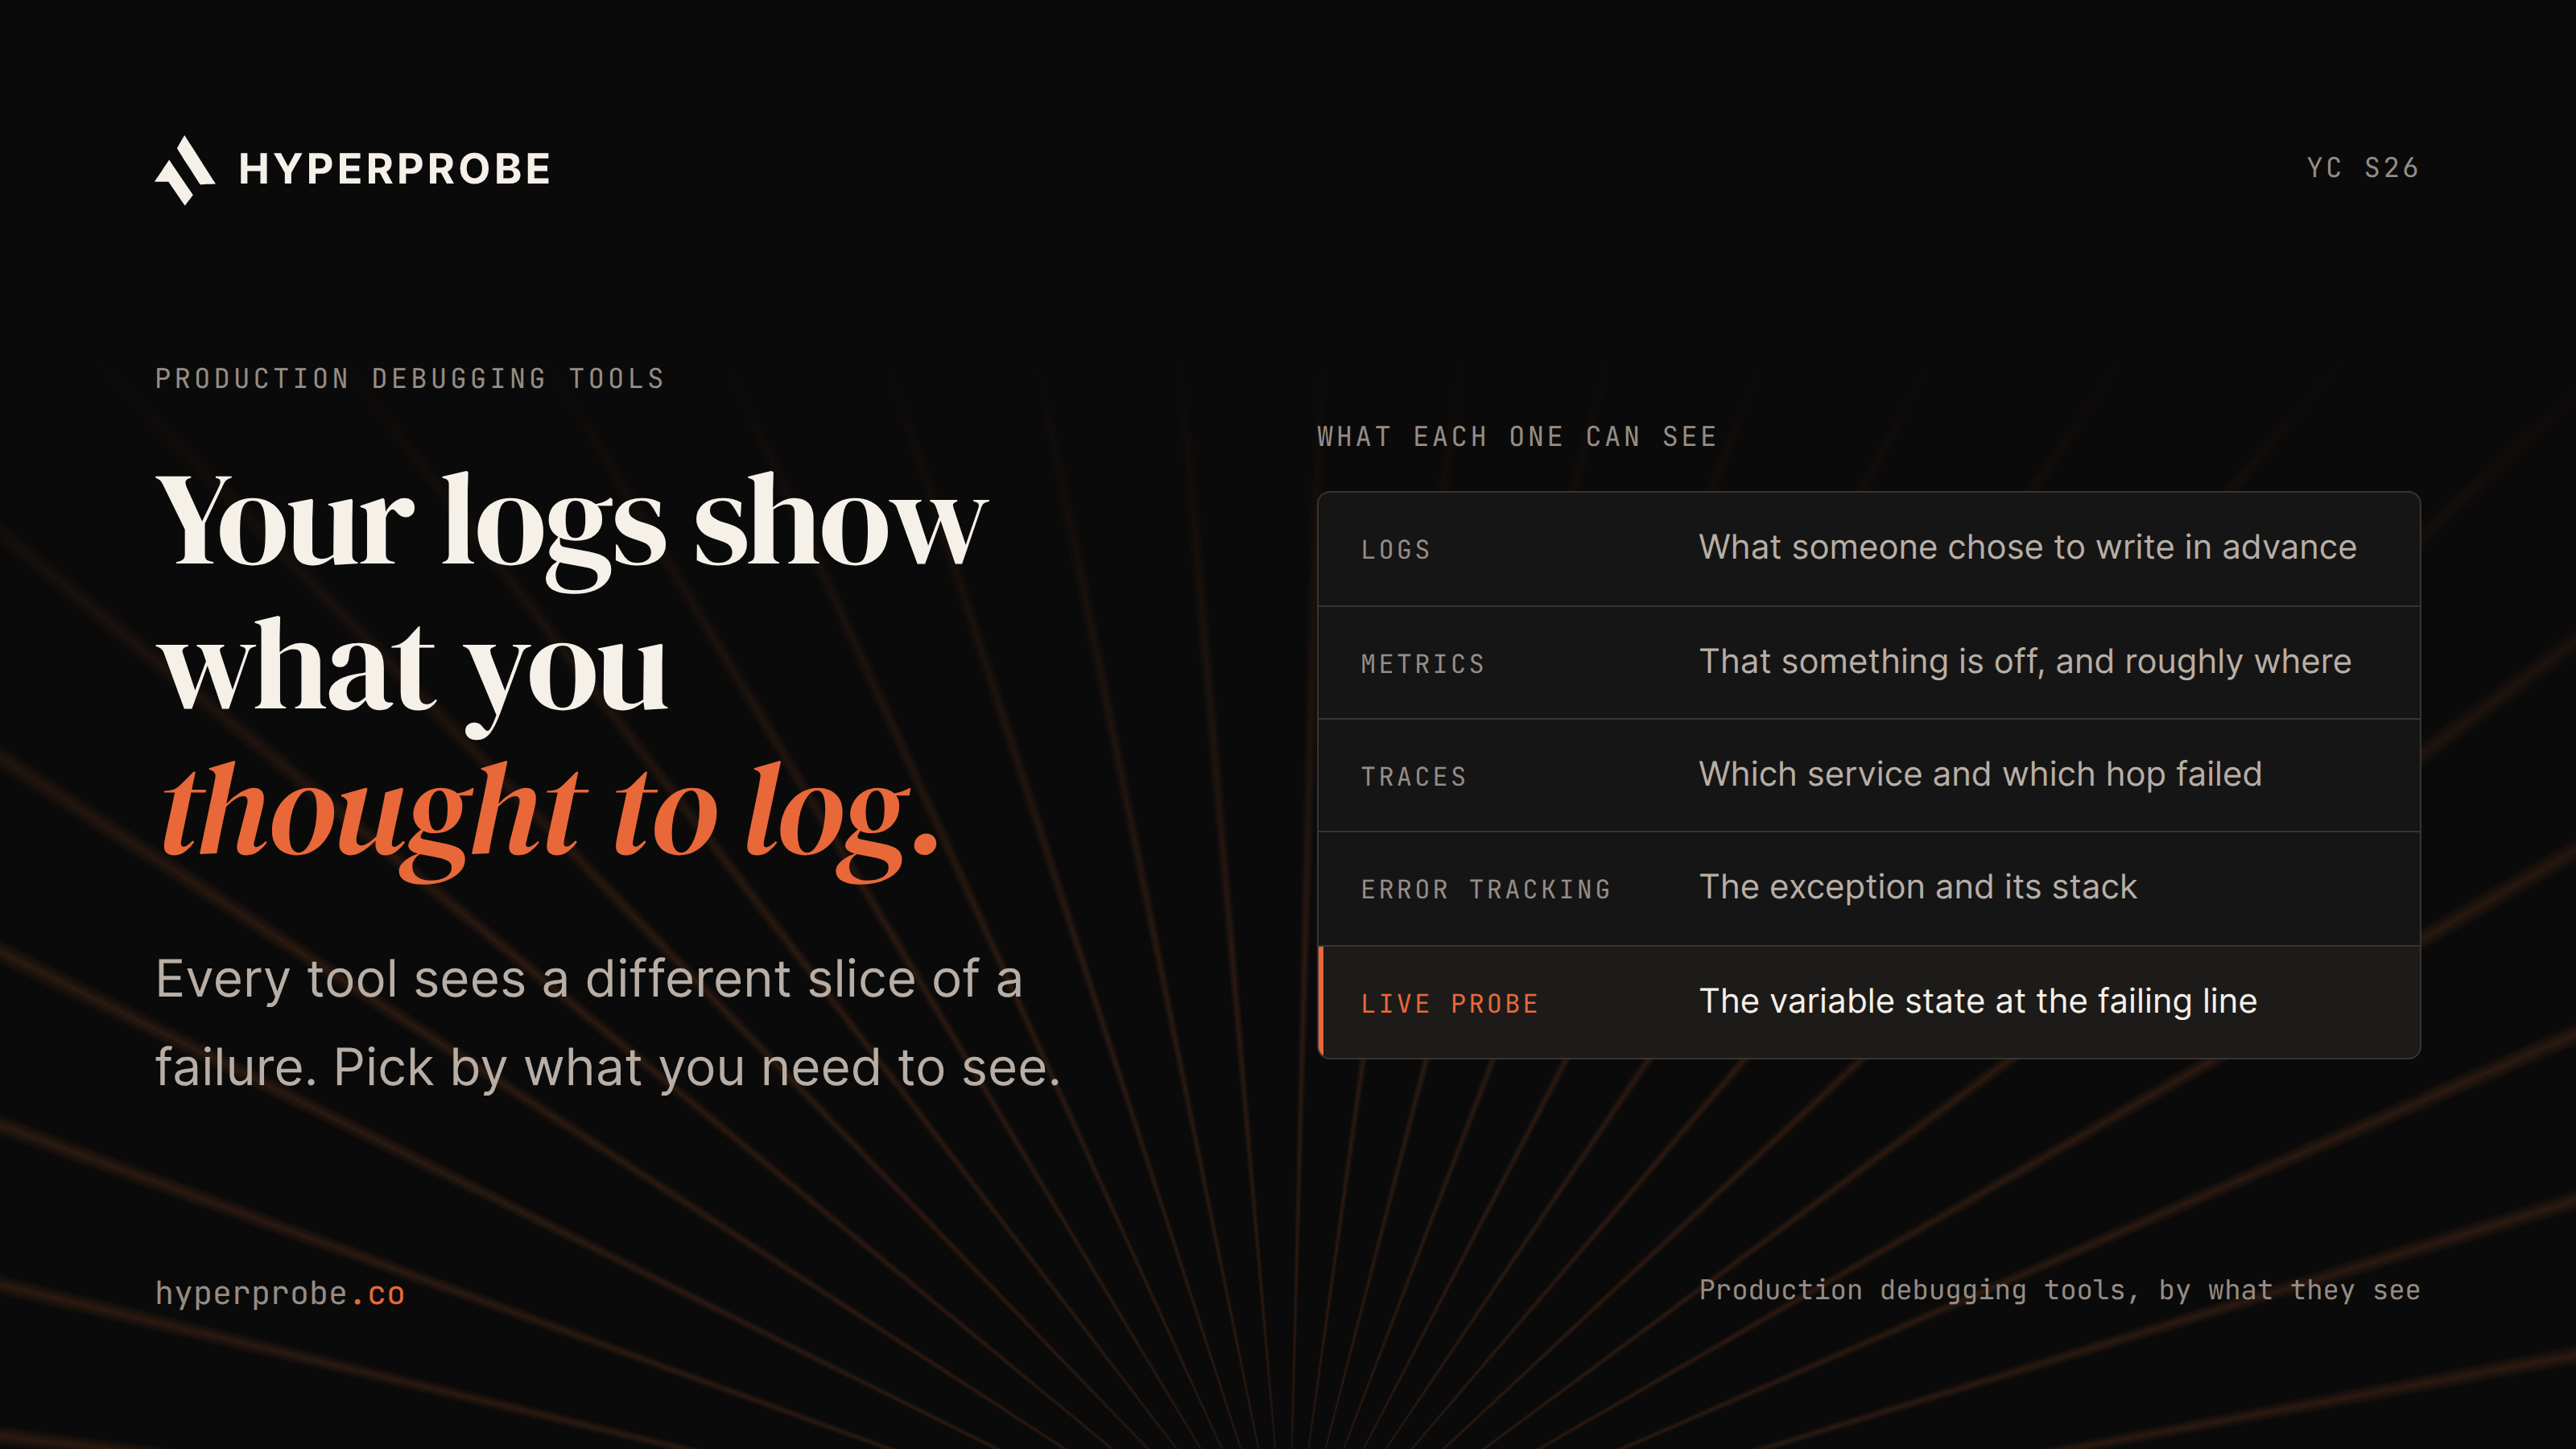
Telemetry stops explaining a failure once the state that caused it was never recorded. That gap shows up in routine choices your team already makes about how to collect and store data:
- Sampling limits: OpenTelemetry recommends sampling when trace volume is high. Head sampling decides early and cannot guarantee that every trace with an error is kept. Even before retention applies, the decision often depends only on what is known when the span starts.
- Instrumentation gaps: A trace only contains the fields someone chose to emit. That level of detail can be enough for performance work, and still fail for a single-request root cause analysis. A span may show that CheckoutService.authorize took 480 milliseconds and returned a 500, and a log may show the exception class, while neither artifact captures the local variable, object state, or branch condition that made that one call fail.
- Cardinality limits: Teams avoid putting every possible value into attributes because high-cardinality fields are expensive to index, store, and query. Some teams aggregate early for the same reason, which narrows what can be asked of the data later. This is a large part of what APM never shows.
- Resource view boundaries: APM may show garbage collection pressure or thread pool exhaustion, which confirms that a resource was under stress. It still does not reveal why one specific request failed as a result, because that explanation may depend on state that was never logged in advance.
A probe enters at this point, capturing live request state at the exact line that matters, which is what the next section covers.
What can a probe capture
A probe exists to capture request-specific program state at the exact line that matters, while the code is running in production. It fills the gap between what tracing already shows and what you need for a clear root cause.
- What a probe is: A probe is a read-only, non-blocking virtual breakpoint on a single line of running production code. When that line executes, it captures local variables, the call stack, and relevant heap state. The request never pauses, and the probe attaches to code that is already running, so nothing is rebuilt or restarted to place one.
- What tracing already gives you: Tracing confirms that a function ran, how long it ran, what downstream calls it made, and whether an error status was recorded. It follows the path of the request and ties services together.
- Where tracing runs out: Tracing usually does not show the exact in-memory state that explains why the function produced the wrong result. When the decisive value never made it into a span or a log line, any investigation layer that only reads existing telemetry is boxed in by that missing evidence.
- How probes fit into the stack: The existing observability stack still leads the investigation. On-call uses traces and logs to narrow the problem, then on-demand probe captures add the missing request-level evidence on the specific line that needs explanation.
How do both work together
APM and an AI SRE layer work together when you treat observability as the first pass, and on-demand captures as a second pass only where needed. The flow looks like this:
| Step |
What happens |
Role of APM and observability |
Role of AI SRE / probe layer |
| 1. Alert fires |
An incident starts from an alert on latency, errors, or saturation. |
Existing monitoring, APM, and alerting detect the symptom and page on-call. |
No role yet. |
| 2. First pass investigation |
On-call inspects traces, logs, dashboards, and the failing route. |
APM and tracing narrow the issue to one service, path, or branch, when the data is already rich enough. |
Still idle, waiting to see whether existing data is enough. |
| 3. Evidence runs out |
Traces point to a function or branch, but the exact cause is unclear. |
APM shows where and when the failure appeared, but not the in-memory state that caused it. |
This is the entry point for a probe. |
| 4. Probe placement |
On-call targets the suspicious line in the running service. |
Existing telemetry guides where to place the probe. |
The agent places a read-only probe on that line without restarts or rebuilds. |
| 5. Capture and analysis |
The next matching requests hit the probe and capture state. |
APM continues to show impact and trends across the system. |
Probe captures live request state at that line so the team can see the values and conditions behind the failure. |
| 6. Fix and confirm |
The issue is diagnosed, patched, and validated. |
APM confirms that errors, latency, and pressure return to normal. |
Additional short-lived probes, if needed, validate the fix on real traffic. |
A real incident with this pattern looks like this:
During a peak traffic period, a core service starts to fail without a clear error pattern in existing telemetry. APM and tracing show where the failures concentrate and how they affect the system, but they do not expose the exact in-memory state behind the behavior. Capturing live memory state at the suspicious line reveals the race condition or bad state, the team ships the fix within the same hour, and APM then shows the impact and recovery at the system level.
Run both for different questions
APM answers where latency, errors, and pressure appear across a system. An AI SRE category purchase answers whether post-alert investigation can move faster when the agent has better evidence. HyperProbe answers a narrower question. It can show what the failing request held in memory at the line that mattered, when the existing telemetry does not already explain it.