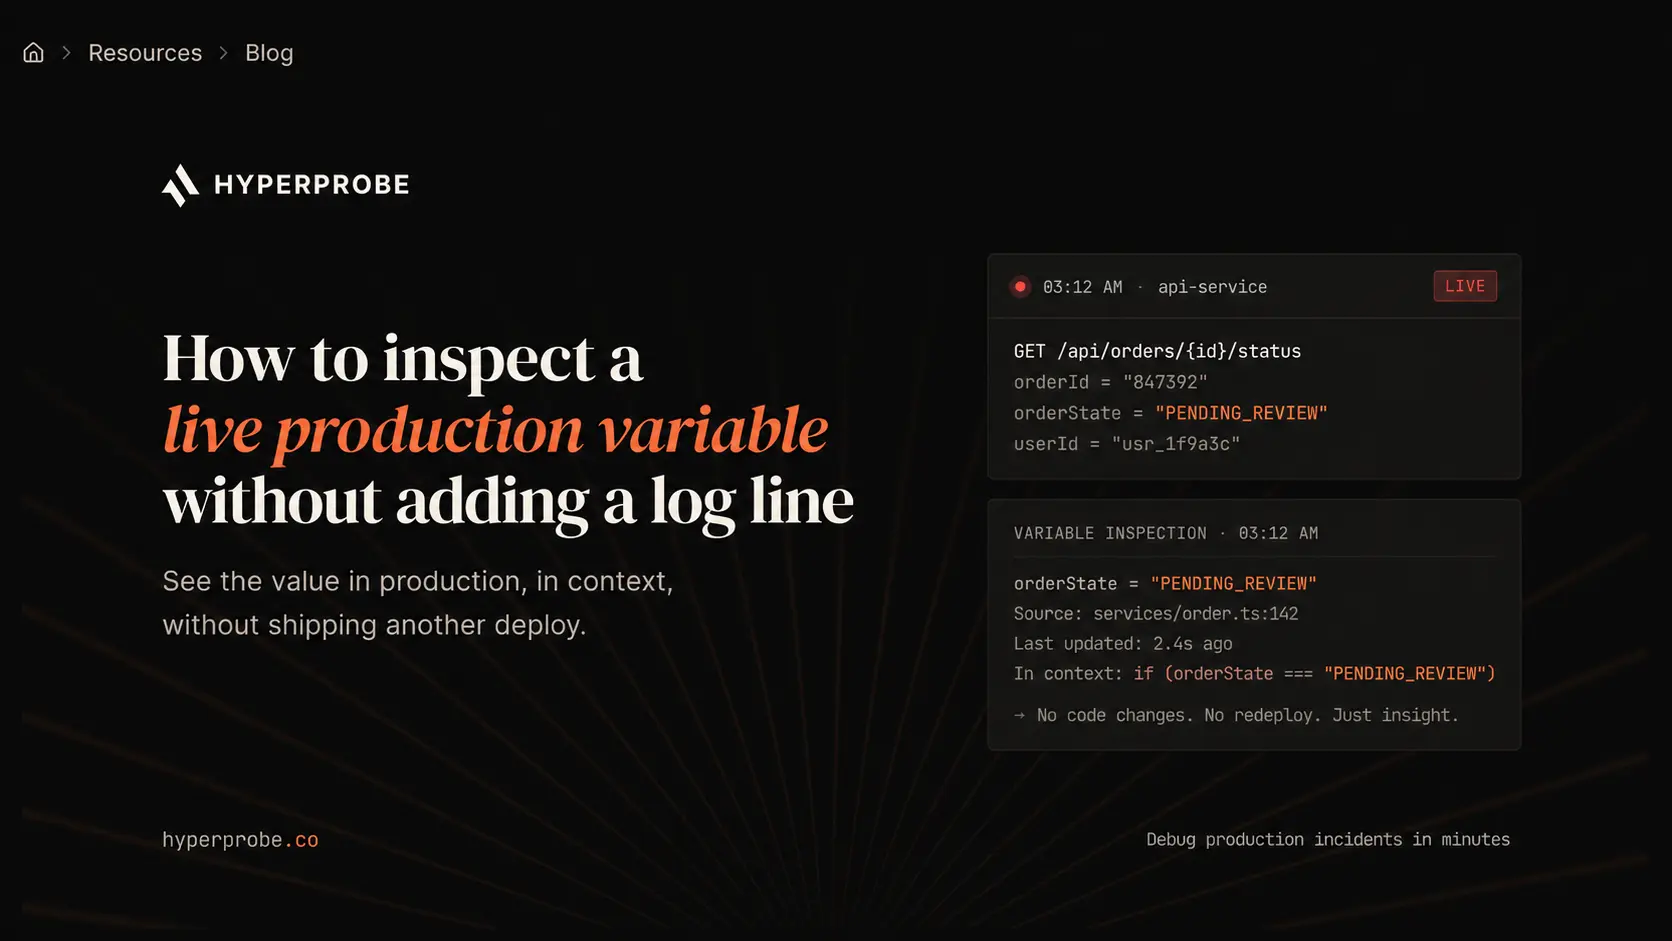
How to inspect a live production variable without adding a log line

A failing request rarely tells you the missing value. The stack trace names a function, the trace shows 480 milliseconds and a 500, and none of that explains why the branch failed. The value that would explain it, the variable held at that exact line, was never written to a log.
The usual move is to add a log statement, open a pull request, wait for CI, and deploy. Dynamic instrumentation gives you a faster path once a compatible agent is already installed. It attaches a temporary, read-only capture point to the running process and, depending on the runtime and platform, lets you inspect locals, arguments, return values, or stack state without shipping a new log line.
This guide shows how dynamic instrumentation works underneath the vendor dashboards, how to set up a safe capture on a live service, and when it belongs next to the logs, metrics, and traces you already run.
Why adding a log line is the wrong first move
A log line looks like a five-minute fix. The pipeline around it rarely is. Writing the change, getting it reviewed, waiting on CI, building an artifact, and rolling it out to production is a full deploy cycle. In active incidents, teams often pay that cost more than once because the first line logs the wrong value, fires too often, or misses the branch that only fails under production traffic.
The real cost shows up on the second attempt. Guessing which variable to log before you've seen the failure is a coin flip, so the team adds another line, waits through another deploy, and watches the incident stretch from minutes to hours while engineers wait on a pipeline instead of reading data.
Research on the broader "guess and redeploy" pattern frames the problem as a repeated deploy, verify, and wait cycle, with production fixes costing more because the team has to diagnose under customer traffic, rollback constraints, and partial evidence.
There is a reason missing telemetry stories stick with engineers. The most frequently cited "$180,000 log line" reference anecdote is not a benchmark, and it should not be treated as one, but it captures the operational shape of the problem: the system can show symptoms everywhere while hiding the one state value that would explain the incident.
None of this is really about the log line. A single logger.info() call takes seconds to write. The redeploy wrapped around it is what costs the hours, and that's the part dynamic instrumentation removes.
What dynamic instrumentation actually is
Dynamic instrumentation attaches a temporary capture point to a specific line or method in a process that is already running, and reads the state at that line without restarting or recompiling the application for that investigation. It does require the service to have the relevant agent or SDK installed first. The agent hooks into the runtime itself rather than the source code.
On the JVM this usually means bytecode instrumentation, where the agent inserts an observation hook around the target line and intercepts execution just long enough to copy the requested state. On Python 3.12 and later, agents can use sys.monitoring, a built-in low-overhead API designed for runtime observation. Other runtimes use hooks suited to their execution model.
The distinction that matters is what happens to the request while the capture runs. A conventional debugger breakpoint suspends the entire thread or process until a human resumes it, which is why nobody runs one against live customer traffic.
Dynamic instrumentation spends a small, bounded amount of time copying the requested state, then lets the request continue without a debugger-style pause.
Two shapes of this show up across vendors:
- A logpoint or breakpoint auto-expires after a set window (AWS defaults to 24 hours, configurable from five minutes up), and suits a one-off investigation during an active incident.
- A probe persists until someone removes it and suits ongoing capture on a spot that tends to misbehave.
Step by step: Capturing a variable without touching a log line
The mechanics differ slightly between platforms, but the workflow underneath is consistent enough to follow regardless of which one you're using.
Step 1: find the exact line, not just the function
Start from what your existing telemetry already narrowed down. A trace or an error log usually points to a function, a route, or a service, not the exact line. Open the source for that function and identify the specific statement where the value in question is assigned, returned, or branched on. Placing the capture one line too early or too late is the most common reason a first attempt comes back empty.
Step 2: choose what to capture
Decide what you actually need: local variables, method arguments, a return value where your runtime supports it, or the full call stack. Most platforms let you name the exact variables to pull rather than capturing everything in scope, which keeps the payload small and readable.
If the failure depends on an object several levels deep, confirm the platform's object traversal depth covers it. AWS's default, for example, walks three levels deep by default and can be extended to five.
Step 3: set capture limits and a condition
Bound the capture before it runs. String length, collection size, object depth, and stack frame count all have sane defaults (AWS caps strings at 255 characters and collections at 20 elements out of the box), and tightening them further keeps output readable during a live incident.
Add a condition where you can, so the probe only fires for a specific user ID, a specific status code, or a specific input shape, rather than every request that touches the line.
# illustrative capture configuration, not tied to one vendor's exact syntax
location:
  file: checkout_service.py
  method: authorize_payment
  line: 142
capture:
  locals: [payment_method, retry_count]
  condition: "retry_count > 2"
  max_string_length: 255
  max_object_depth: 3
  rate_limit_per_second: 1
  expires_in_minutes: 30
Step 4: attach the probe to the running service
Submit the configuration through whatever interface your platform exposes, a CLI command, an API call, or a UI panel tied to a Debug Session. The agent already running inside your service picks up the configuration, typically within a minute or two, and starts watching that line. Nothing about the running process restarts. The next request that reaches the line, and matches any condition set, triggers the capture.
Before you trust the result, confirm the capture is attached to the service instance you meant to inspect. Service name, environment, version, and commit SHA matter here. A probe on checkout-api in staging tells you nothing about the production pod returning 500s, and a probe mapped to yesterday's commit can land on the wrong statement after a refactor. Treat the target metadata as part of the debugging evidence, not as setup trivia.
Step 5: read the captured snapshot
The snapshot arrives as structured data: the requested variables, their values at that moment, and (if requested) the surrounding stack. Read it the way you'd read a debugger's variable pane rather than a log line, since it's a full point-in-time view rather than a single formatted string. If the value confirms the hypothesis, you're done. If it doesn't, adjust the condition or the line and try again, all without another deploy.
Guardrails that make this safe on production traffic
Running anything against live traffic invites a reasonable set of questions from whoever owns the service. Four guardrails answer most of them.
The capture point is read-only by design. It cannot write memory, execute arbitrary code, or alter control flow, which is what separates it from a debugger you'd never point at production. Some platforms enforce this at the architecture level rather than through a policy setting someone could misconfigure.
Rate limits and expiry keep incident captures bounded automatically. Some platforms distinguish short-lived breakpoints from persistent probes, so the exact lifecycle depends on the vendor and configuration. In HyperProbe's model, probes are bounded by a time to live, a maximum hit count, and a rate limit per second, so they clear themselves once any of those limits are hit. Datadog's Live Debugger, for comparison, caps variable-capture logpoints at one execution per second per service instance.
Sensitive fields get redacted by default before a snapshot ever leaves the host. Keys matching common patterns, password, token, secret, authorization, cookie, get scrubbed automatically, and teams can usually extend the list for domain-specific fields.
Commit alignment keeps a capture honest about what code it's actually looking at. HyperProbe, for instance, requires the running service to report the exact commit SHA it's on before a probe can attach, so a capture never gets checked against the wrong version of the function.
How this fits with the observability stack you already have
Dynamic instrumentation doesn't replace logs, metrics, or traces. It picks up where they run out. Telemetry collected in advance tells you what happened across the system: which service slowed down, which route is erroring, where a dependency is under pressure. That's the job APM and distributed tracing are built for, and they're usually the fastest route from a system-wide symptom to a specific service or code path worth investigating.
The gap shows up once tracing has narrowed the problem to one function and the trace still can't say why that function returned the wrong thing. A span can show that a call took 480 milliseconds and failed. It can't show the local variable, the branch taken, or the object state that made it fail, because nobody decided in advance to log that specific value.
Dynamic instrumentation is the on-demand step for exactly that gap: existing telemetry gets you to the right function, and a capture on the right line gets you the value that explains it. For a deeper look at how this investigation layer relates to the rest of an incident response stack, see what an AI SRE actually does and how it compares to APM.
When to reach for this vs. other techniques
Reach for dynamic instrumentation when your logs and traces already point at the right function but stop short of the right value, when the failure doesn't reproduce reliably outside production, or when shipping a new deploy carries more risk than a read-only capture would. It's also the better call when an incident is active and every redeploy cycle spent adding a log line is a redeploy cycle not spent fixing the problem.
Use a normal log change when the signal should remain useful after the incident. For example, a missing business event, a persistent audit trail, or a permanent error counter belongs in the codebase. Use a feature flag or config change when the safest fix is to turn behavior off.
Use a profiler when the question is CPU, memory, or lock contention rather than object state at one line. Dynamic instrumentation is strongest when the missing evidence is temporary, narrow, and tied to a specific execution path.
It isn't the right tool when the cause sits outside the running code path entirely. DNS misconfiguration, load balancer routing rules, credential stuffing, and third-party billing or provider outages can all produce symptoms inside your application while the actual fault lives somewhere a code-level probe can't see. Those need their own diagnostic path, not a capture on a line of your service.
Bringing it back to the incident
The engineer from the opening didn't need a new deploy. They needed one value, at one line, while the request that exposed the bug was still happening. Attach a read-only, self-expiring capture to code that's already live, read the snapshot, act on it, all inside the same incident call.
HyperProbe builds this pattern into an AI on-call agent that sits alongside the observability stack you already run: read-only probes, self-clearing on their own time limit and rate limit, measured at under 1% CPU overhead at 3,000 requests per second with no added latency in HyperProbe's own benchmarks.
Schedule a demo to see where it fits into your next on-call rotation.
Frequently asked questions
Is dynamic instrumentation safe to run on production traffic?
Yes, when the platform is built for it. A dynamic instrumentation capture point is read-only: it cannot write memory, execute arbitrary code, or alter control flow. It also runs bounded by a rate limit, a maximum hit count, and a time to live, so a capture clears itself and never becomes a permanent load on the service. This is different from a traditional debugger breakpoint, which suspends the thread or process and is not something anyone runs against live customer traffic.
Does dynamic instrumentation require a redeploy or restart?
No. The agent that supports dynamic instrumentation already runs inside your service. Adding a capture point means sending a new configuration to that agent, typically through a CLI command, an API call, or a UI panel. The running process keeps executing without a rebuild or restart.
What's the difference between a breakpoint and a dynamic instrumentation probe?
A conventional breakpoint pauses the entire thread or process until a human resumes it, which is why it is only used in local development. A dynamic instrumentation probe, sometimes called a logpoint, captures the requested state at a specific line and lets the request continue immediately. Some platforms distinguish a short-lived, auto-expiring capture from a longer-lived probe meant for ongoing observability on a specific line.
Which languages support dynamic instrumentation?
Support varies by vendor, but Java, Python, and .NET are broadly supported, with Node.js, Go, Ruby, and PHP covered by several platforms as well. JavaScript and TypeScript support is sometimes limited to line-level captures rather than full method-level probes. Check your platform's documentation for the minimum SDK or agent version required, since older versions can produce a degraded experience.
Does dynamic instrumentation replace logging and APM?
No. Logs, metrics, and traces still do the job of showing what happened across a system in advance, which service slowed down, which route is failing, and where a dependency is under pressure. Dynamic instrumentation is the on-demand step that runs after that telemetry narrows the problem to a specific function, when the exact variable value or object state was never captured in the first place.
Written by
Founder
Shailendra Singh is the founder and CEO of HyperProbe (YC S26), an AI on-call agent that debugs production incidents by capturing evidence directly from running services. He has over a decade of experience building and running production systems, starting at Applied Materials before moving into startup operating and engineering leadership roles, including at a company that later became a unicorn. He founded and ran Transporter.city from 2017 to 2021, then spent three years building HyperTest before founding HyperProbe with Karan Raina. He writes about production debugging and incident response.
RELATED READS