MCP servers for debugging production and what each gives an agent


An MCP server gives Claude Code a structured way to query a production system during an investigation. Sentry can return errors and stack traces. Datadog can expose logs, metrics, and APM data. PagerDuty can provide incident and on-call context. Each server gives the agent a different type of evidence.
The important limitation is simple: an MCP server can only return data that your systems already collected. It cannot recover a variable that was never logged, traced, or captured. This guide compares the leading MCP servers for production debugging, explains what each one contributes, and shows where runtime evidence can complete the investigation.
Quick answer
The best Claude Code MCP server depends on the evidence you need. Choose Sentry for exception-first debugging, Datadog for broad observability, Honeycomb for high-cardinality tracing, PagerDuty for incident coordination, and Grafana or cloud-provider servers for open-source telemetry and infrastructure events.
Start with one read-only connection tied to your primary incident workflow, then expand only when a clear evidence gap remains.
What an MCP server actually does for a debugging agent
MCP is an open standard, originally published by Anthropic, that connects AI applications such as Claude Code to external tools and data sources through one consistent interface.
- Tools let the agent perform schema-defined actions, such as
search_datadog_logs. - Resources provide read-only context, such as a runbook or service catalog entry.
- Prompts provide reusable instruction templates for common workflows.
During a debugging session, Claude Code calls a tool and receives structured evidence, such as an error list, stack trace, or incident record. The agent can then reason over that evidence without asking an engineer to copy screenshots into the chat.
Because MCP connections commonly use HTTP, OAuth, or API tokens, every server also creates a trust boundary around production data. Review the MCP architecture documentation before granting access.
In practical terms, an MCP server is a permissioned bridge between an AI agent and one system of record, such as an error tracker, telemetry platform, or on-call tool.
Why teams are wiring MCP servers into Claude Code for incidents
MCP removes the copy-and-paste work that slows incident response. Without it, an engineer has to pull logs, screenshot dashboards, and paste error text into a chat. The agent then needs the same process repeated whenever it asks for another piece of context.
The Claude Code MCP documentation describes incident workflows such as checking recent errors and identifying the deployment that introduced a regression. You can add a server with claude mcp add and verify configured connections with claude mcp list. The commands are simple, so the harder decision is choosing which systems contain the evidence your team needs.
MCP server comparison
| MCP server | Evidence it exposes | Best fit | Main limitation |
|---|---|---|---|
| Sentry | Exceptions, stack traces, releases, and performance data | Error-first debugging | Cannot show state that was never captured |
| Datadog | Logs, metrics, traces, monitors, and dashboards | Broad observability across services | The breadth can increase query noise |
| PagerDuty | Incidents, alerts, schedules, and escalation policies | Incident coordination | Provides context, not runtime proof |
| Honeycomb | High-cardinality traces, BubbleUp analysis, and service maps | Finding unusual segments | Depends on useful trace fields |
| Grafana and cloud providers | Metrics, logs, traces, pods, and cluster events | Open-source stacks and infrastructure | May require several systems to explain an application failure |
| Debugger MCPs | Breakpoints, stepping, and variable inspection | Local development and CI | Pausing a production process is risky |
What Sentry MCP gives the agent
Sentry MCP is designed for coding agents such as Claude Code and Cursor. It lets an agent search errors, analyze performance, and triage issues from an editor or terminal. Core capabilities include issue search, release data, performance data, and a get-event-stacktrace tool that returns actionable frames for a specific event. The Sentry MCP repository documents the available tools and setup details.
Some conversational search tools require an LLM provider configured on Sentry's side, as described in the Sentry MCP repository. Sentry is a strong first connection when exceptions and releases are the primary incident signals. It can move an investigation from a reported error to a stack trace quickly, but it cannot reveal application state that Sentry never captured.
What Datadog MCP gives the agent
Datadog MCP gives an agent access to APM traces, logs, metrics, monitors, dashboards, incidents, and security signals. A tool such as search_datadog_logs lets Claude Code query the platform directly. Datadog also documents connections for Claude Code, Cursor, VS Code, and Copilot CLI.
Datadog is a good fit when it serves as the system of record across application and infrastructure telemetry. Its broad surface can create more noise, however. Teams focused mainly on exceptions may reach a stack trace faster through Sentry MCP.
What PagerDuty MCP gives the agent
PagerDuty MCP provides incident and coordination context. Its tools include get_incident, list_incidents, list_alerts_from_incident, on-call schedules, and escalation policies. Read access is the default. Write actions, such as creating or resolving an incident, require the explicit --enable-tools flag described in the PagerDuty MCP repository.
This makes PagerDuty useful for answering questions such as who is on call, what has already been tried, and how an incident has escalated. It does not confirm the technical root cause. Review PagerDuty's current deployment and data-handling options against your compliance requirements before connecting it to an agent.
What Honeycomb MCP gives the agent
Honeycomb MCP focuses on high-cardinality tracing. Its distinctive run_bubbleup tool compares a selected subset of query results with the overall baseline. It can surface the dimension that explains an anomaly, such as region, customer tier, or build version.
That answers a different question from a stack trace: why is one segment behaving differently? Honeycomb has also added heatmaps, histograms, and Service Map generation to MCP responses. Choose it when incidents depend on outliers and service segments rather than discrete exceptions.
What Grafana and cloud provider MCPs give the agent
Grafana and cloud-provider MCPs cover the open-source and infrastructure sides of debugging. Grafana integrations can give an agent access to sources such as Prometheus, Loki, and Tempo, depending on the configured stack. Check the Grafana MCP documentation to verify current capabilities before setup.
Kubernetes and cloud-provider MCPs for AWS, Google Cloud, or Azure sit one layer lower. They can expose pods, cluster events, and infrastructure logs or metrics. Use them when the likely cause is a crashed pod, resource limit, scaling event, or another platform condition. Keep mutating actions behind explicit policy controls.
Debugger MCP servers are a different category
Everything above queries telemetry that already exists: logs that were printed, spans that were instrumented, and metrics that were emitted. Debugger MCP servers work differently.
Projects such as [claude-mcp-debugger](https://github.com/bastiencb/claude-mcp-debugger) and [debugger-mcp](https://github.com/Govinda-Fichtner/debugger-mcp) bridge Claude Code to language-native debuggers through the Debug Adapter Protocol. Depending on the project and language, their tools can include debug_launch, debug_set_breakpoints, debug_step_over, and debug_evaluate.
This is a different capability from an observability MCP. A live debugger can pause execution, inspect variables, and step through code. That makes debugger MCPs useful in local development and CI.
Using breakpoints on a production service under real traffic requires much stricter controls, because a pause can affect requests that reach the breakpoint.
What determines whether an MCP server actually speeds up debugging
Not every observability MCP is equally efficient, even when the servers cover similar data. A comparison published by Pydantic found that servers with a SQL-like query layer over telemetry, such as Logfire and ClickStack, resolved one multi-step debugging scenario in two to three tool calls.
Servers without that structure needed more round trips for pagination, aggregation, or manual verification.
When evaluating an MCP server, measure how many tool calls an agent needs to move from a question to a defensible answer. The number of exposed tools matters less than the quality of the query interface.
The gap none of these MCP servers close
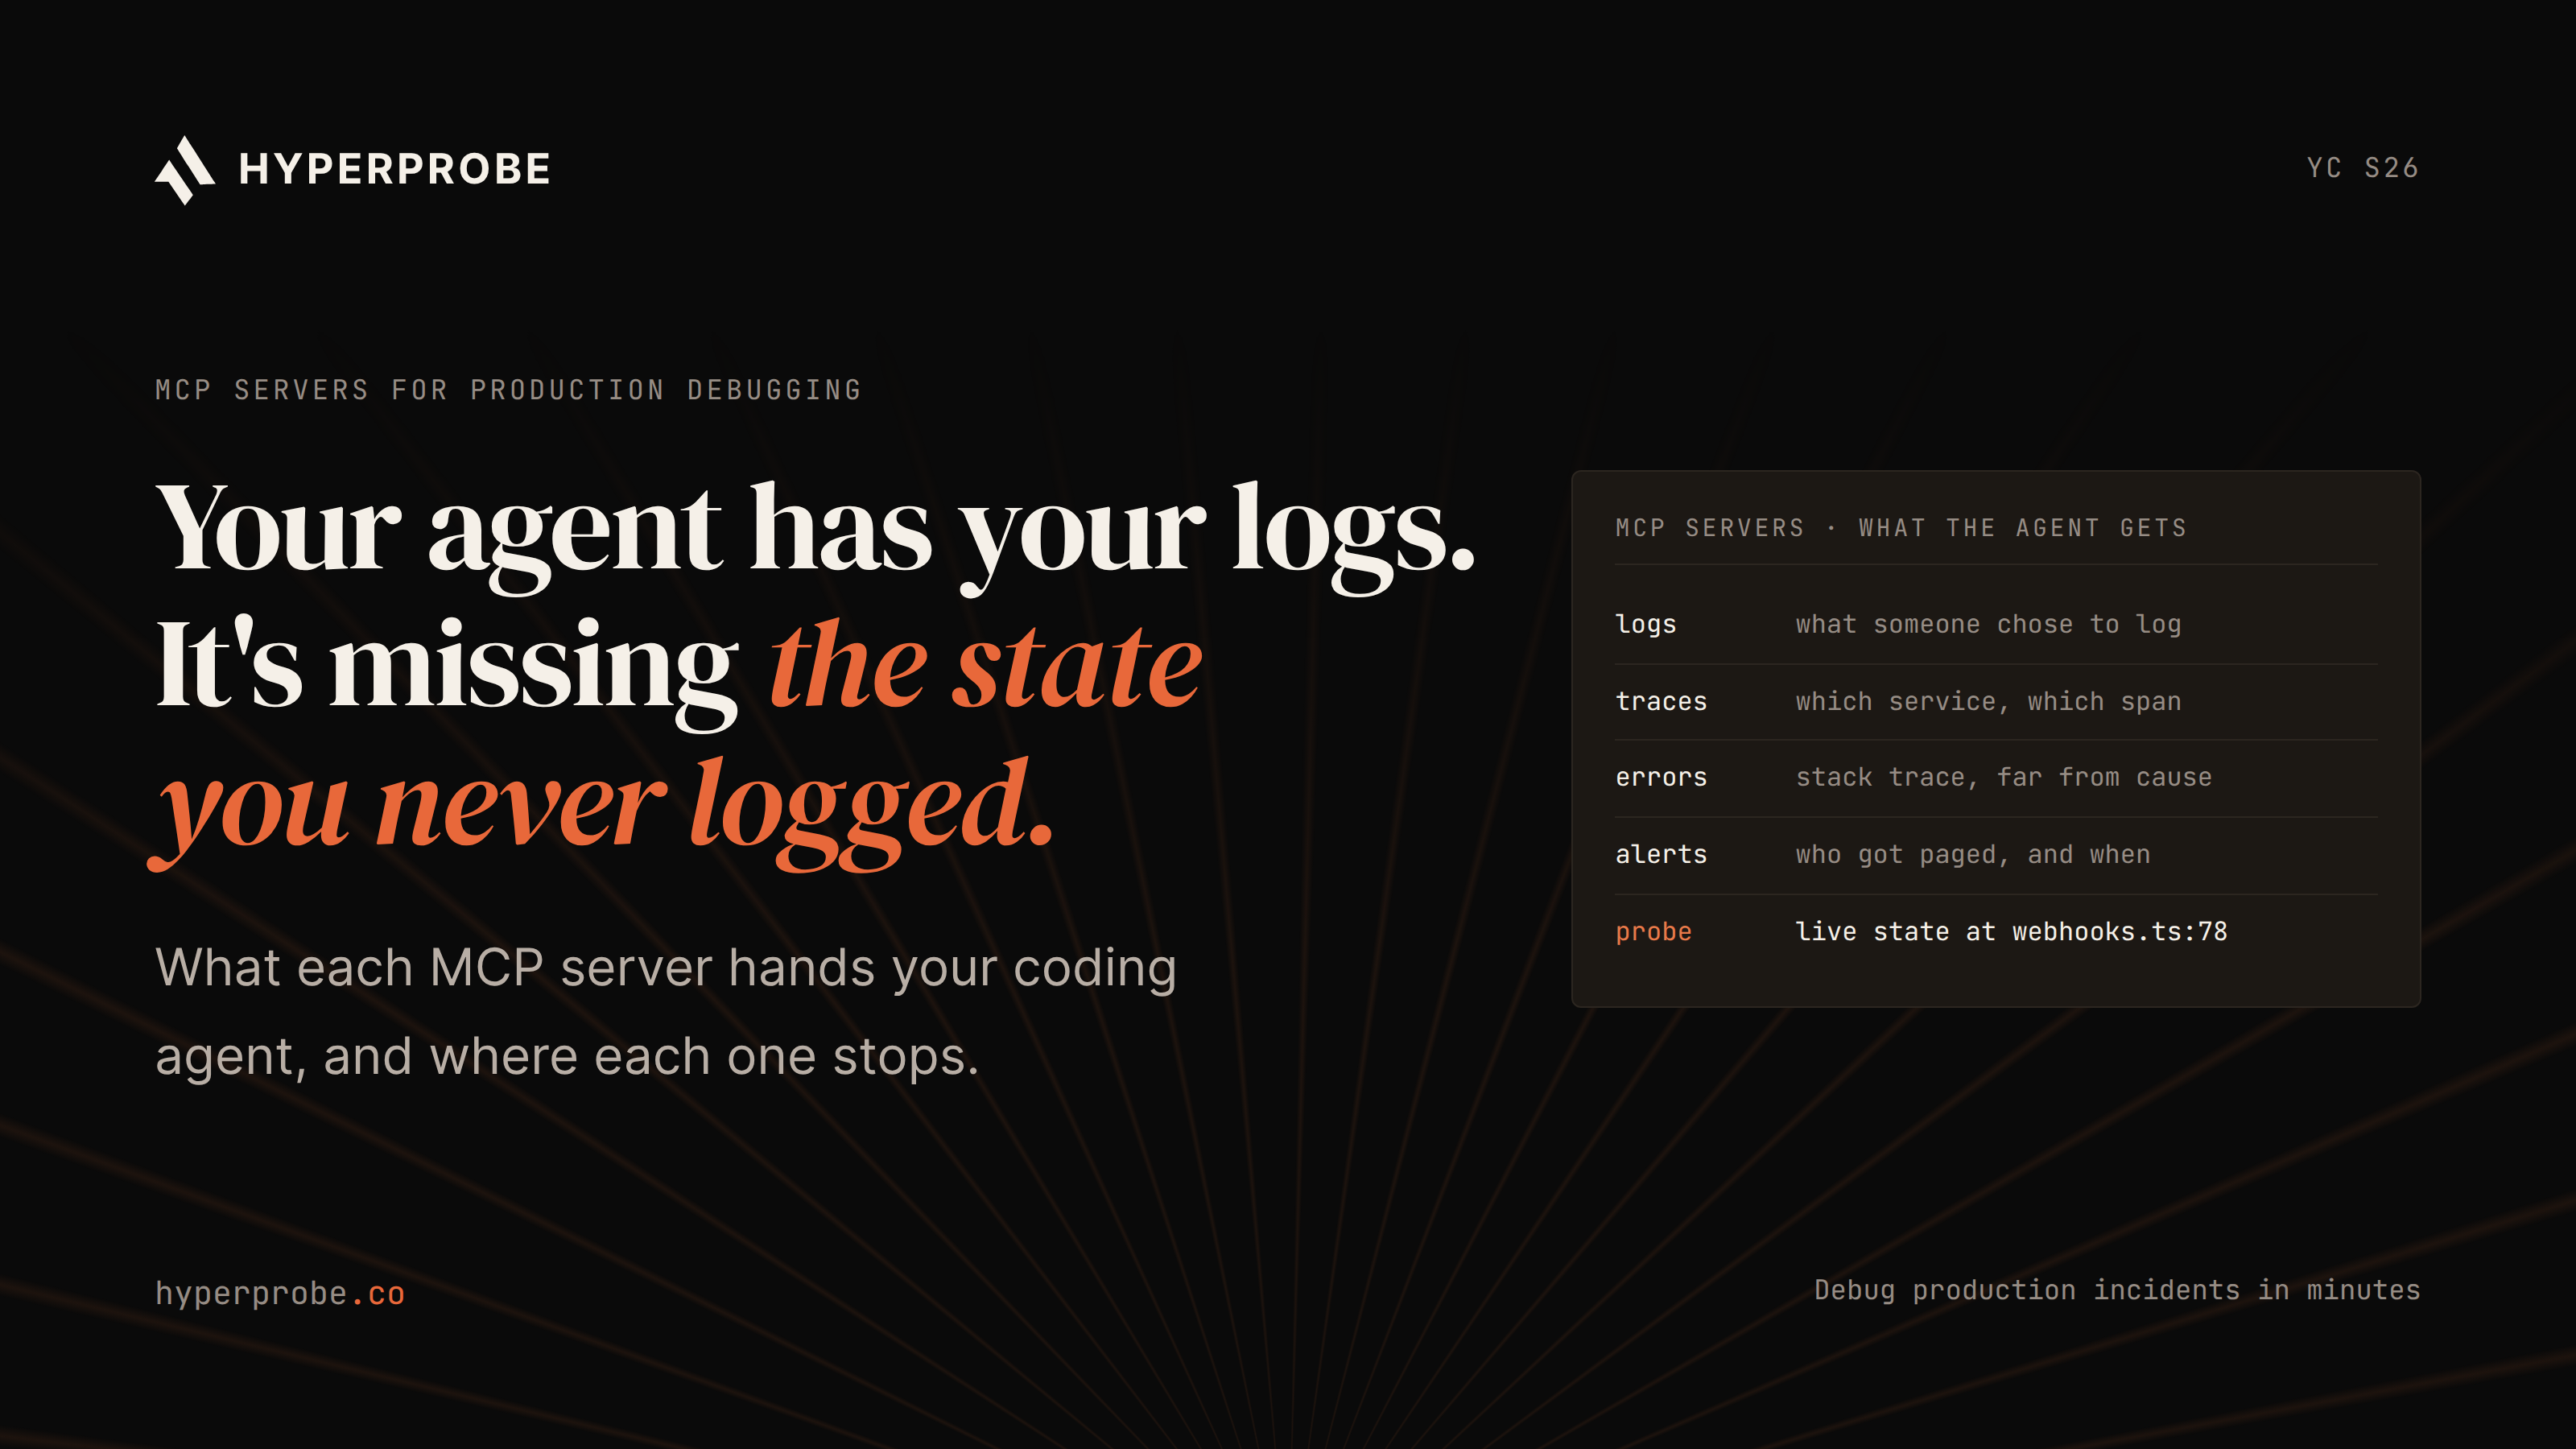
Observability MCP servers such as Sentry, Datadog, Honeycomb, and Grafana can only work with data that was already collected. If a variable was never logged, a field was never attached to a span, or an object’s state was never captured, an MCP query cannot retrieve it later.
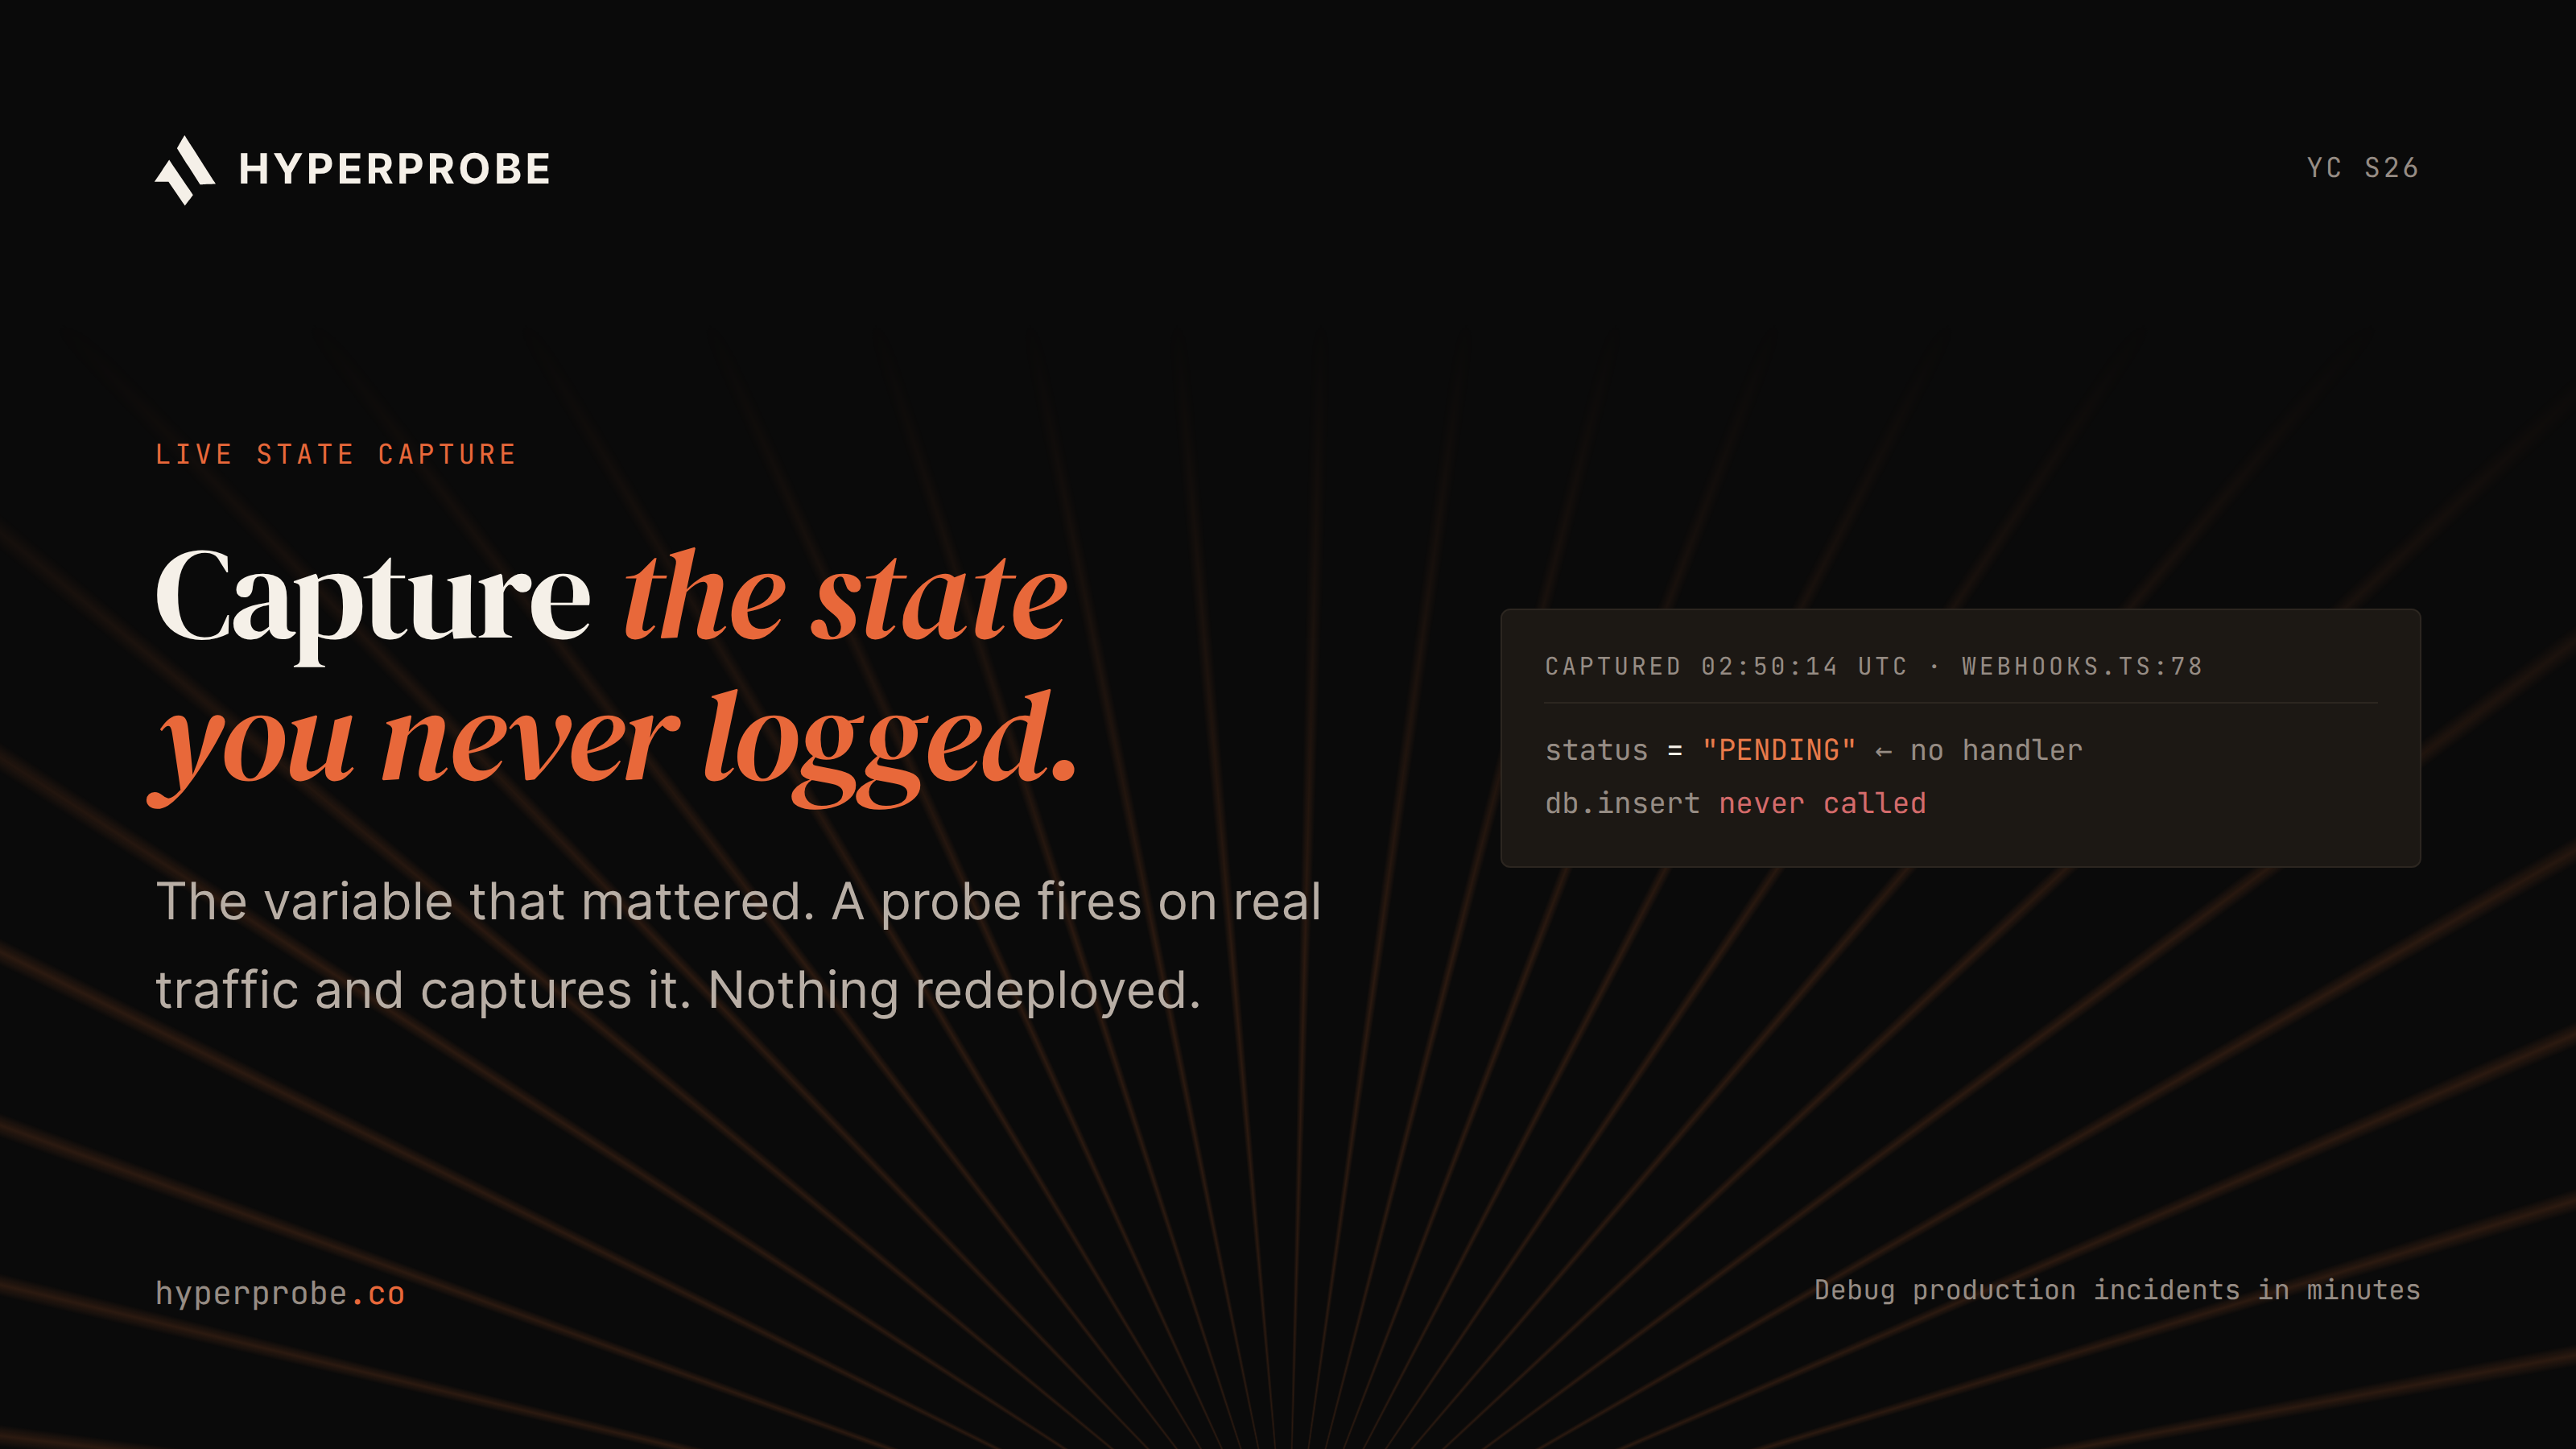
This is where dynamic instrumentation for production debugging adds another layer of evidence. Traces can show that a function executed and where a request travelled, but they may not reveal the runtime state that caused the failure.
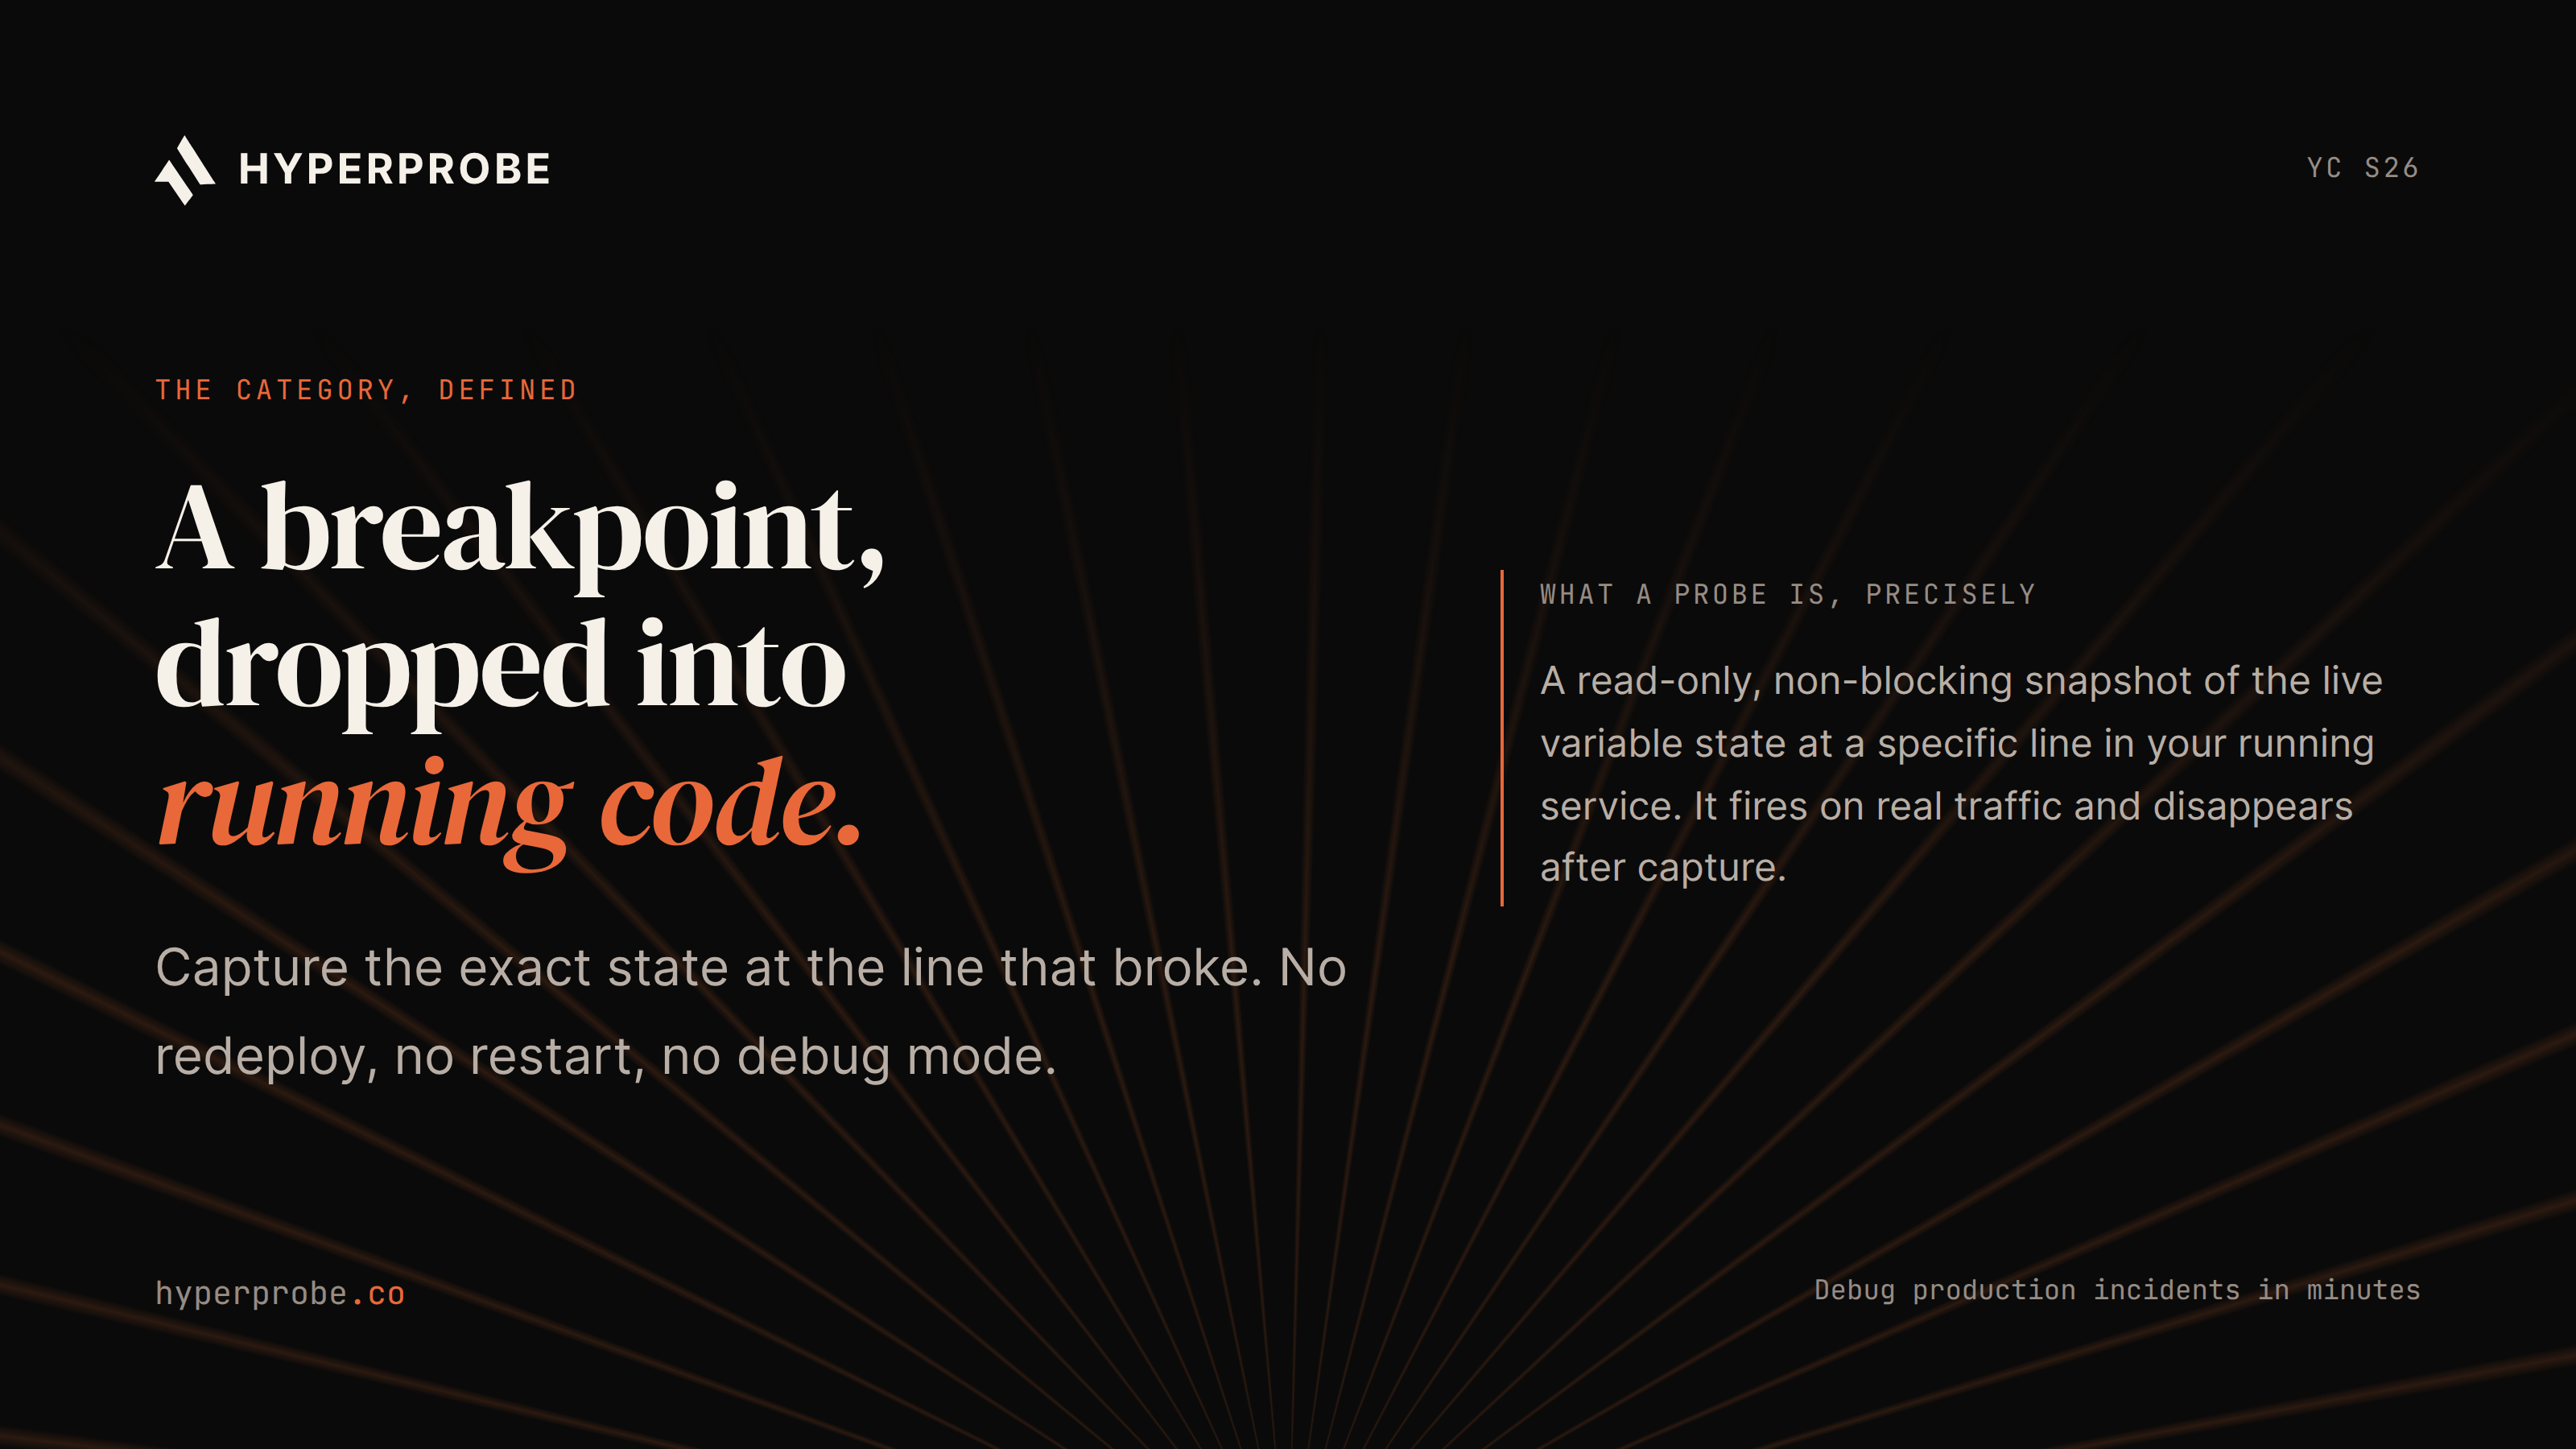
HyperProbe can place a read-only probe at the relevant line of code and capture values such as variables, configuration flags, or partially constructed objects without requiring a redeploy. This makes it possible to capture variables directly from running code when existing logs and traces do not contain enough context.
The two approaches are complementary. Observability MCPs help agents investigate the telemetry your stack already has. HyperProbe helps capture the missing runtime evidence needed to explain issues that were not fully instrumented in advance.
Security considerations before you connect an MCP server to production data
Connecting an MCP server to production systems creates a prompt-injection risk that teams should assess. Anthropic's issue tracker documents a case where a malicious MCP server embedded hidden instructions in a tool response, and Claude Code treated those instructions as user input.
Security researchers have also described indirect injection through README files, fetched web pages, and API responses. These reports describe possible attack paths, not a claim that every MCP response is malicious.
Use these safeguards before connecting an MCP server to production data:
- Treat every tool response as untrusted data, not as an instruction.
- Prefer read-only access for investigation workflows.
- Scope API tokens to the smallest useful set of projects and actions.
- Pin server versions and review source code before installation.
- Redact or restrict customer data wherever the platform allows it.
The Claude Code MCP security checklist covers related controls. These precautions matter because debugging servers often access logs and traces that contain customer information.
How to choose which MCP servers to connect first
Start with the system of record for your most common incident type:
- Exceptions and crashes: Choose Sentry MCP for issue search, stack traces, and release context.
- Cross-service latency or resource pressure: Choose Datadog or Honeycomb for broader telemetry and correlation.
- On-call coordination: Choose PagerDuty MCP for incident state, schedules, and escalation history.
- Open-source telemetry or infrastructure failures: Choose Grafana or a cloud-provider MCP.
A small team running one service rarely needs five servers. A larger platform team running many services across Kubernetes may need Datadog or Honeycomb plus infrastructure-level access. Match the connection to the incident evidence you lack, rather than to the size of a vendor's tool catalog.
Add each server in read-only mode first. Verify the agent's queries, then widen access only when the workflow is trusted.
Choose the right evidence layer
MCP servers make it easier for agents to retrieve and analyze the incident data your observability stack has already collected. But they cannot recover information that was never captured in the first place.
HyperProbe adds that missing runtime context by using read-only probes to capture variable and object state at the point where a failure occurs. Used alongside tools such as Sentry, Datadog, or Honeycomb, it gives agents additional evidence when logs and traces are not enough to confirm the root cause.
The practical approach is simple: use MCP to access the telemetry you already have, keep production access read-only, and add runtime capture when the existing evidence leaves gaps. The HyperProbe quickstart shows how to add probe-based debugging to an existing investigation workflow.
Frequently asked questions
What is an MCP server in simple terms?
An MCP server is a structured bridge between an AI agent like Claude Code and one external system, such as an error tracker or a metrics platform. It exposes tools the agent can call, read-only resources for context, and reusable prompt templates through the open Model Context Protocol standard.
Can Claude Code use MCP servers to fix production bugs automatically?
MCP servers let Claude Code retrieve evidence such as stack traces, logs, incident records, and metrics. Retrieval is not the same as root-cause confirmation. The agent can only surface data that the connected system already captured, so an engineer still needs to review the findings and approve production changes.
Is it safe to connect an MCP server to production observability data?
It can be, with the right precautions. Treat MCP responses as untrusted data, prefer read-only servers, scope API tokens narrowly, pin server versions, review source code, and restrict or redact customer data before connecting an MCP server to production systems.
Do I need a different MCP server for every tool in my stack?
No. Start with the MCP server tied to your primary incident system, such as Sentry for exception-heavy teams, Datadog or Honeycomb for cross-service correlation, or PagerDuty for on-call coordination. Add another server only when a specific evidence gap justifies the added access and trust surface.
How is a debugger MCP different from an observability MCP?
An observability MCP queries collected telemetry such as logs, traces, and metrics. A debugger MCP attaches a live debugger and exposes tools for breakpoints, stepping, and variable inspection. Debugger MCPs are strongest in local development and CI because pausing a production process can affect live traffic.
Written by
Founder
Shailendra Singh is the founder and CEO of HyperProbe (YC S26), an AI on-call agent that debugs production incidents by capturing evidence directly from running services. He has over a decade of experience building and running production systems, starting at Applied Materials before moving into startup operating and engineering leadership roles, including at a company that later became a unicorn. He founded and ran Transporter.city from 2017 to 2021, then spent three years building HyperTest before founding HyperProbe with Karan Raina. He writes about production debugging and incident response.
RELATED READS