How to Capture a Variable That Was Never Logged

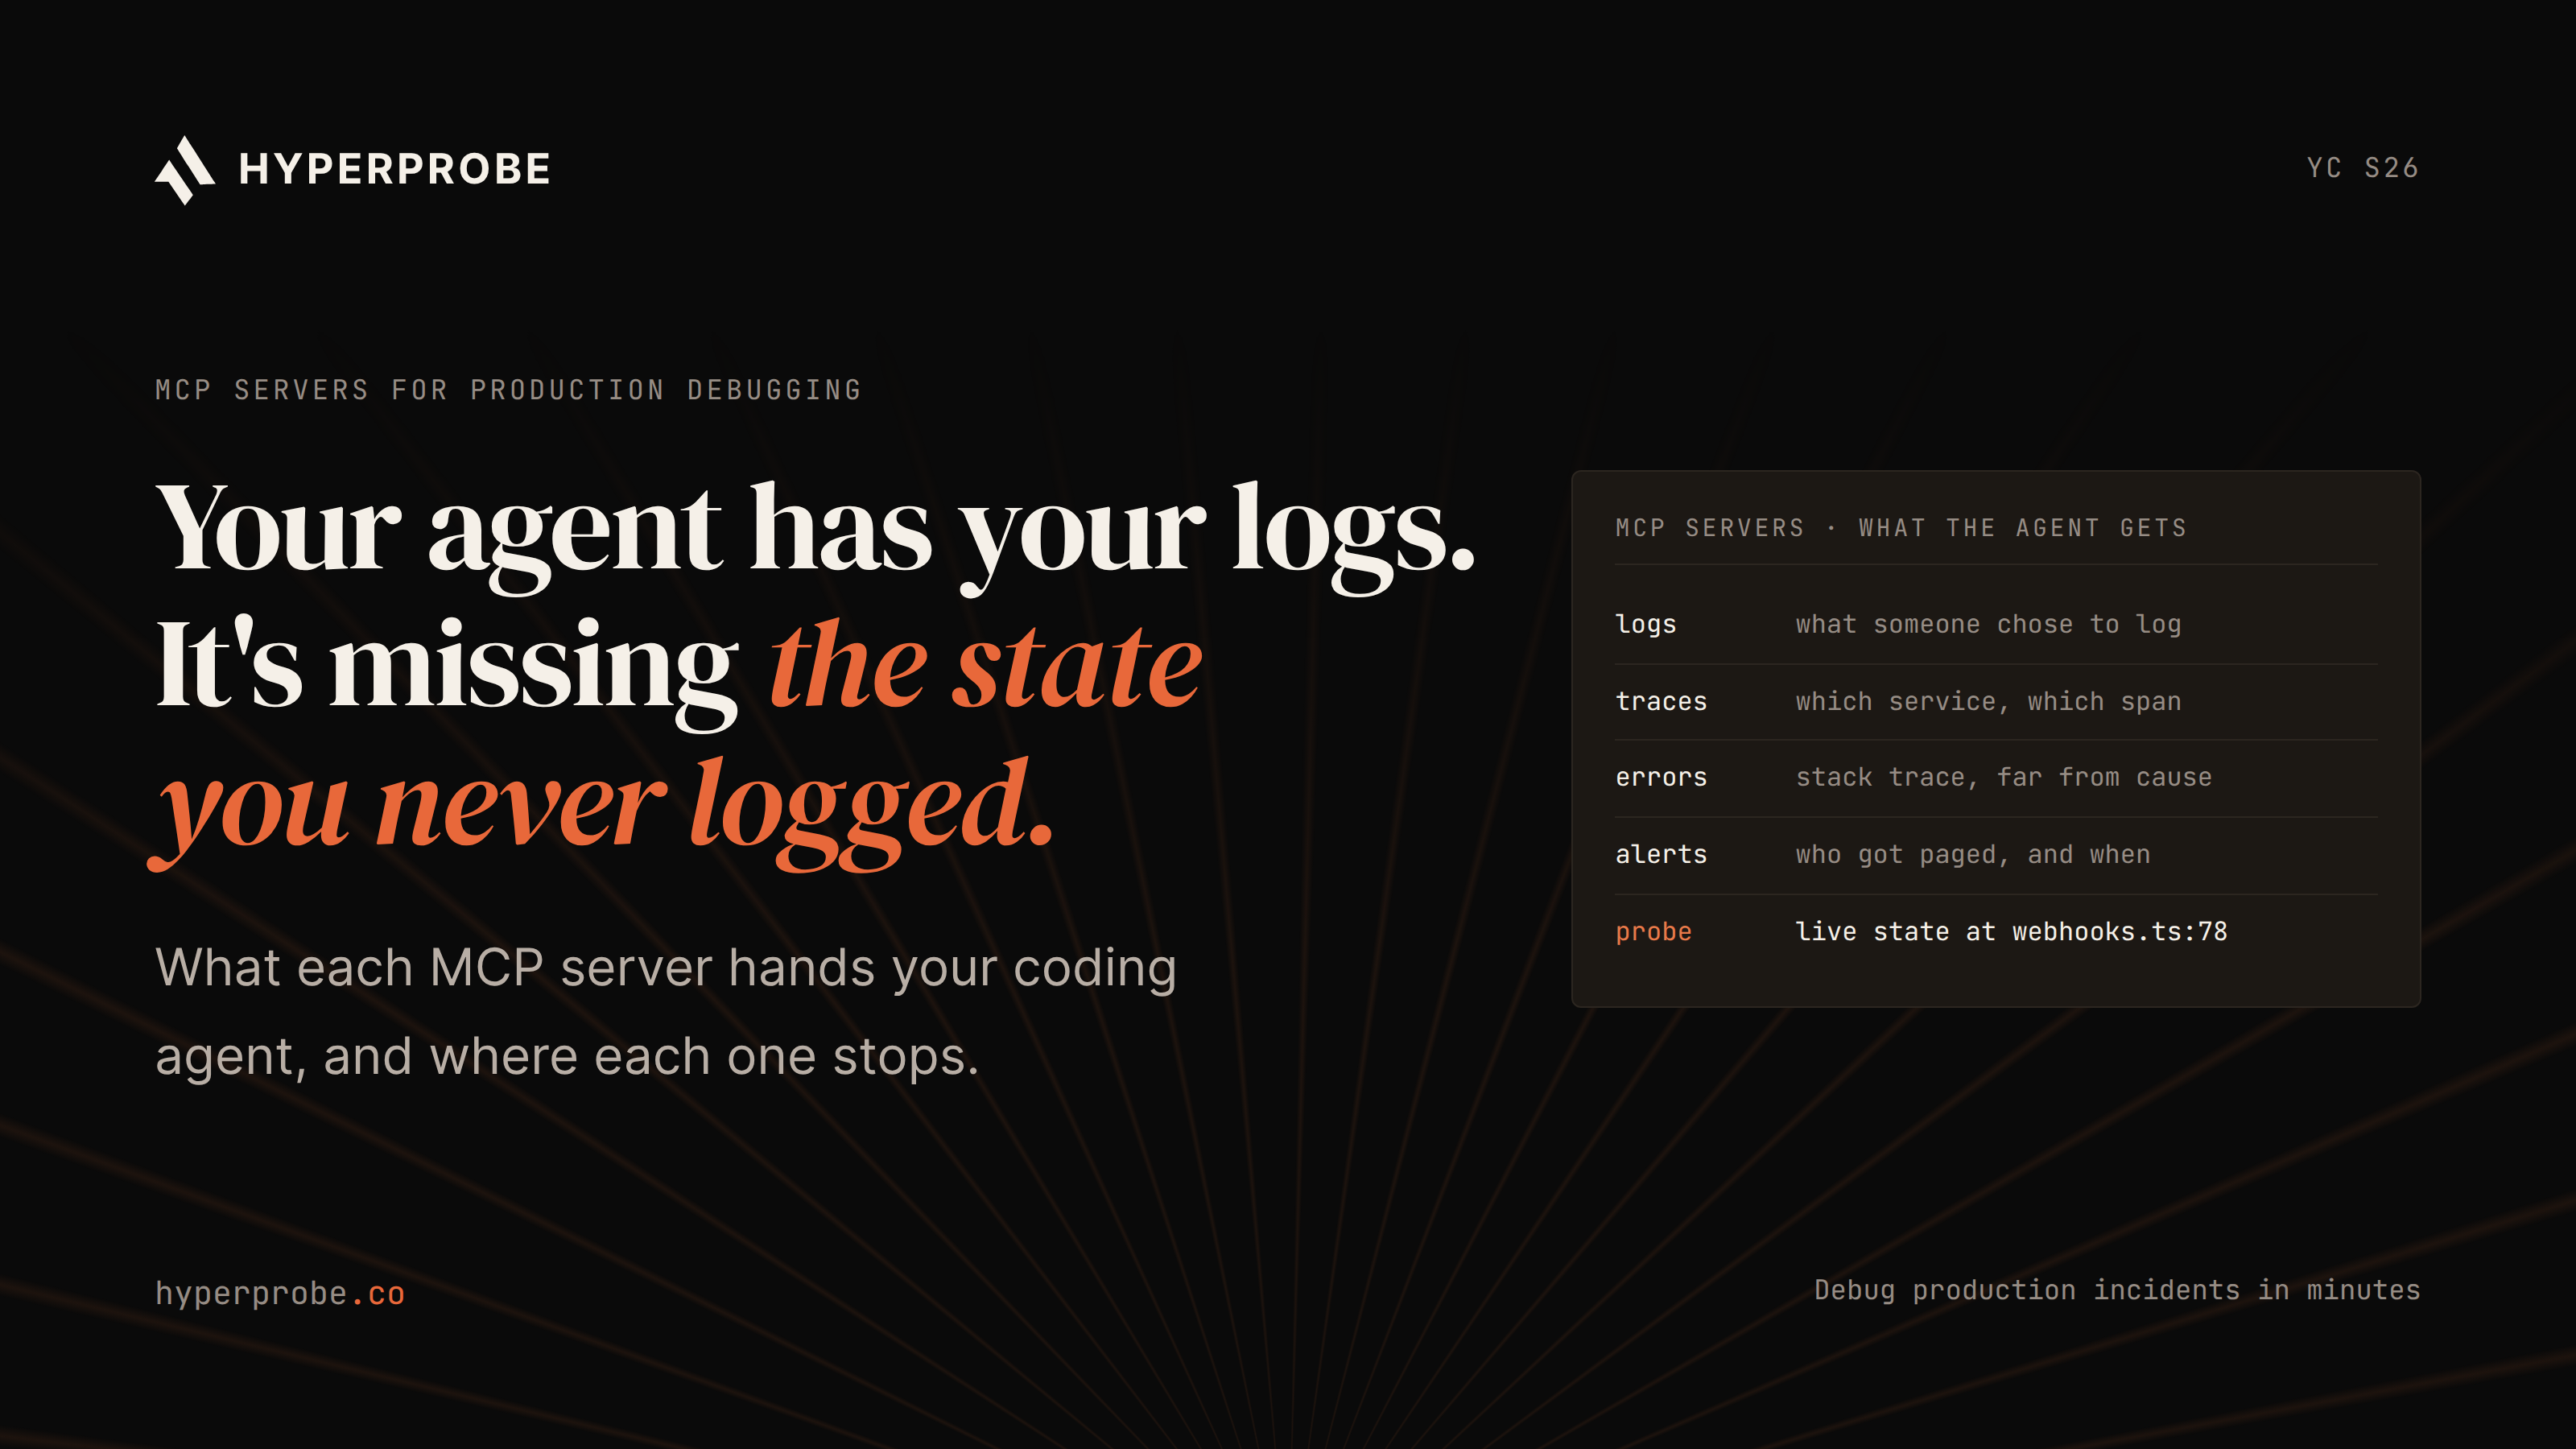
A request fails, the error page loads, and the stack trace names a function that has run cleanly ten thousand times before today. Somewhere inside that function, a variable held the value that would explain the failure. Nobody logged it, because nobody had a reason to expect this particular input, this particular branch, this particular edge case.
Learning how to capture variables in code without a pre-existing log line comes down to a choice between four approaches: printing or logging after a redeploy, attaching an interactive debugger, using a runtime inspection tool built for your language, or attaching a read-only probe to the process that's already running. HyperProbe belongs in that last category. It is designed for production investigation, where the missing value exists in a live service and adding a log line would mean waiting for another deployment.
Each approach trades speed, safety, and production-readiness differently. Picking the wrong one is how a five-minute question turns into a multi-hour incident.
This guide walks through why the value went unlogged in the first place, what each capture method actually does under the hood, and how to decide which one fits the situation in front of you.
Why the variable was never logged
Teams don't skip logging out of carelessness. A codebase that logged every local variable at every branch would flood the pipeline with noise, slow the application down, and cost real money in storage and ingestion. Engineers log what they expect to need: the request ID, the response code, the handful of fields that past incidents taught them to watch.
The gap shows up when a failure takes a path nobody anticipated. A null slipped through a validation check that was supposed to catch it. A third-party library returned a shape of data the integration code didn't expect. A hot path had its logging stripped out during a performance pass six months ago, and the team who did it never imagined this exact line would matter again.
That's just what happens when live systems meet real traffic: the input space is larger than anyone's log statements can cover in advance. The useful question isn't why the value went unlogged. It's how to get it now, with the incident already open.
The real cost of adding a log line
Writing a single logger.info() call takes seconds. What wraps around it doesn't. A team facing a missing variable typically writes the change, opens a pull request, waits for a reviewer, lets CI run, builds a new artifact, and rolls it out to the affected environment. That's a full deploy cycle spent to answer one question.
The first attempt often comes back empty. Guessing which variable to log, and under what condition, before you've actually seen the failure reproduce is close to a coin flip. Log the wrong field, and the team repeats the entire cycle: another pull request, another review, another wait.
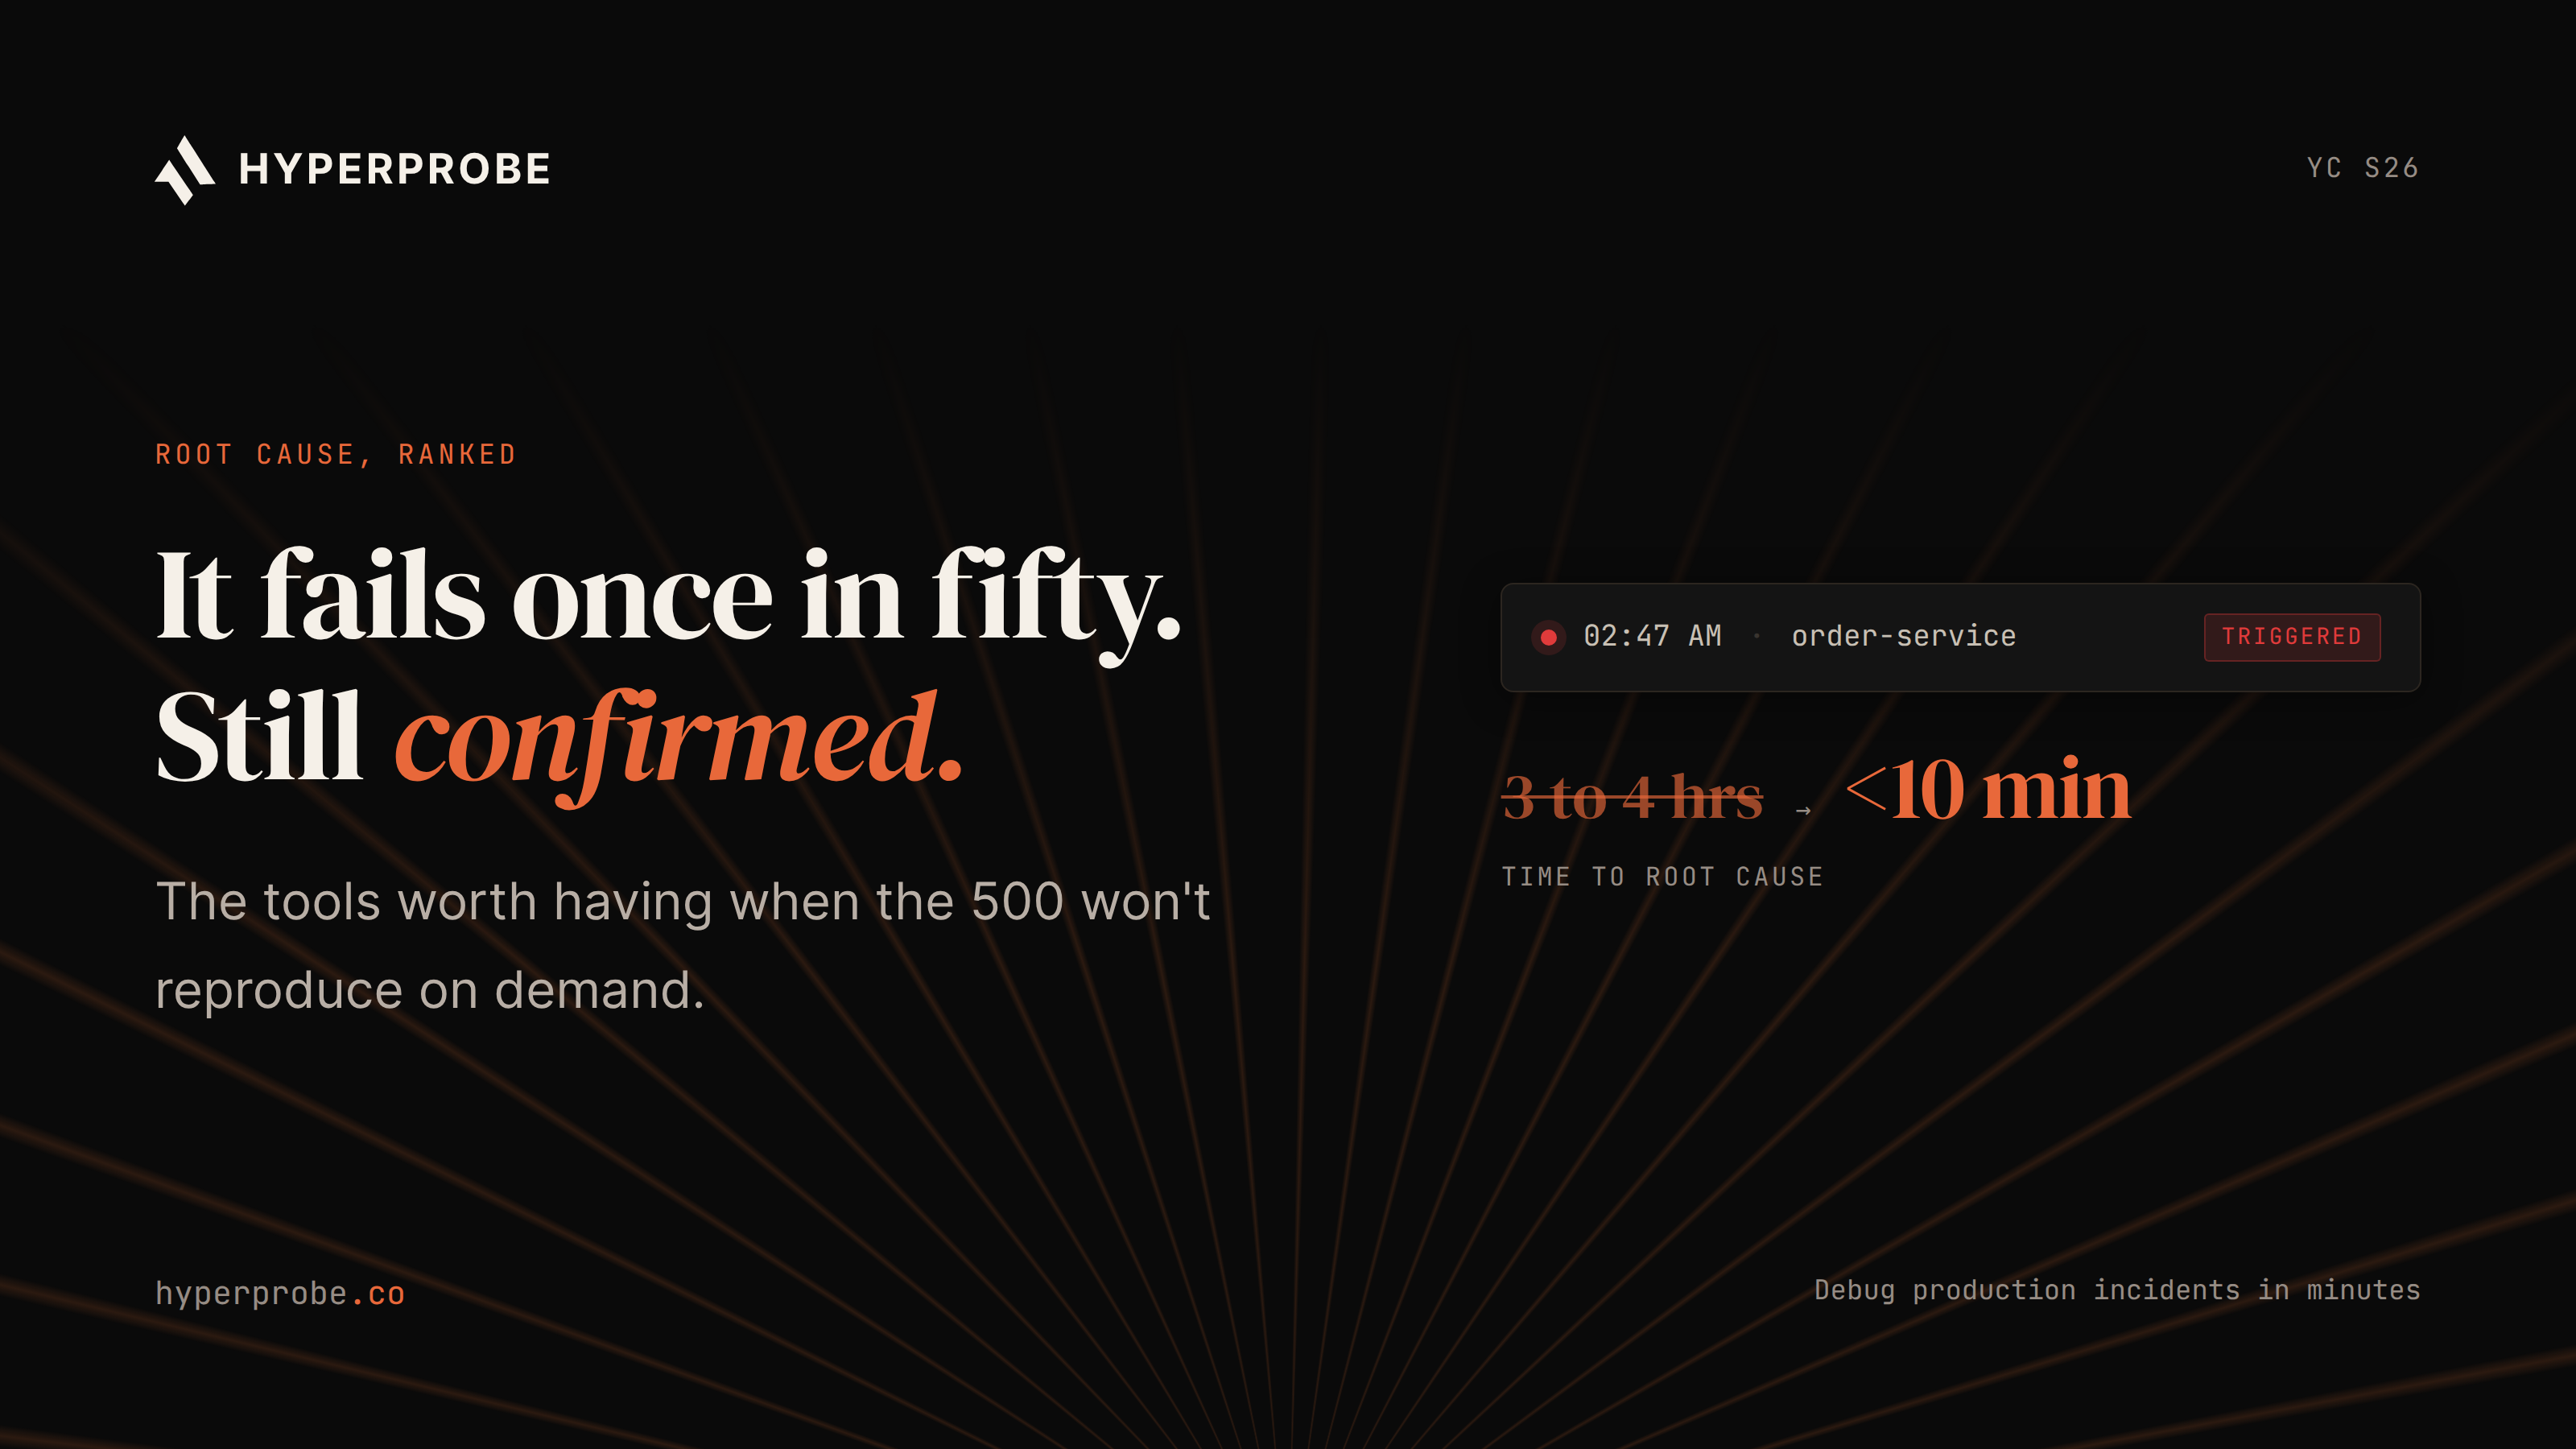
An incident that could have taken minutes stretches into hours, not because the underlying bug was hard to fix, but because the team spent that time waiting on a pipeline instead of reading data.
This is the core reason the other three approaches exist. Each one is a way to see the value without paying the deploy tax again.
Four ways to capture a variable in code
Print and console statements
Adding a print(), console.log(), or equivalent is the fastest change to write and the easiest for any engineer to understand. It also carries every cost described above: a code change, a review, a deploy, and a wait for the failure to reproduce again under the new build.
This approach works best when a bug reproduces reliably and consistently once you know roughly where to look, and when the team has room in the schedule for another deploy.
It's the wrong choice during an active incident where every redeploy cycle is a cycle not spent fixing the actual problem, and it's a poor fit for failures that only show up under production traffic and won't reproduce in staging.
Interactive debuggers and tracing libraries
Tools like pdb and ipdb in Python, browser developer tools, and IDE debuggers let you pause execution at a breakpoint and inspect every variable in scope. Stack Overflow's widely cited answer on watching variables in pdb covers techniques like the display command to continuously print a watched expression, conditional breakpoints that only trigger when a variable meets a specific value, and the third-party watchpoints library for change-triggered watches.
These are strong tools for local development and staging environments where pausing a single process doesn't affect anyone else.
A related category is the tracing library, which instruments a function without manual print statements. PySnooper decorates a function and records which lines ran, in what order, and how local variables changed over the course of execution. Ptera takes a similar approach with selectors that probe specific variables across function scopes and stream their values as the code runs.
Both add real overhead and are meant for development, not for attaching to a service handling live customer requests.
The limitation that matters for production: a debugger breakpoint suspends the entire thread or process until a human resumes it. Nobody points that at a service currently serving customers.
Runtime inspection at the process level
Below the debugger sits a lower-level option: reading state directly from a running process through the runtime's own protocols. On the JVM, the Java Debug Wire Protocol can expose stack frames, local variables, fields, and thread state to an attached debugger.
That access is useful for controlled development or diagnostic environments, but conventional JDWP debugging can suspend threads, and capabilities vary by runtime and tool. It should not be treated as a production-safe, read-only capture method by default.
This kind of direct process access is powerful precisely because it operates below the application code, but it demands specialized tooling knowledge specific to each language runtime and careful control of process access. It is rarely something a team reaches for casually during an incident unless the environment and operating procedure were prepared in advance.
Dynamic instrumentation and read-only probes
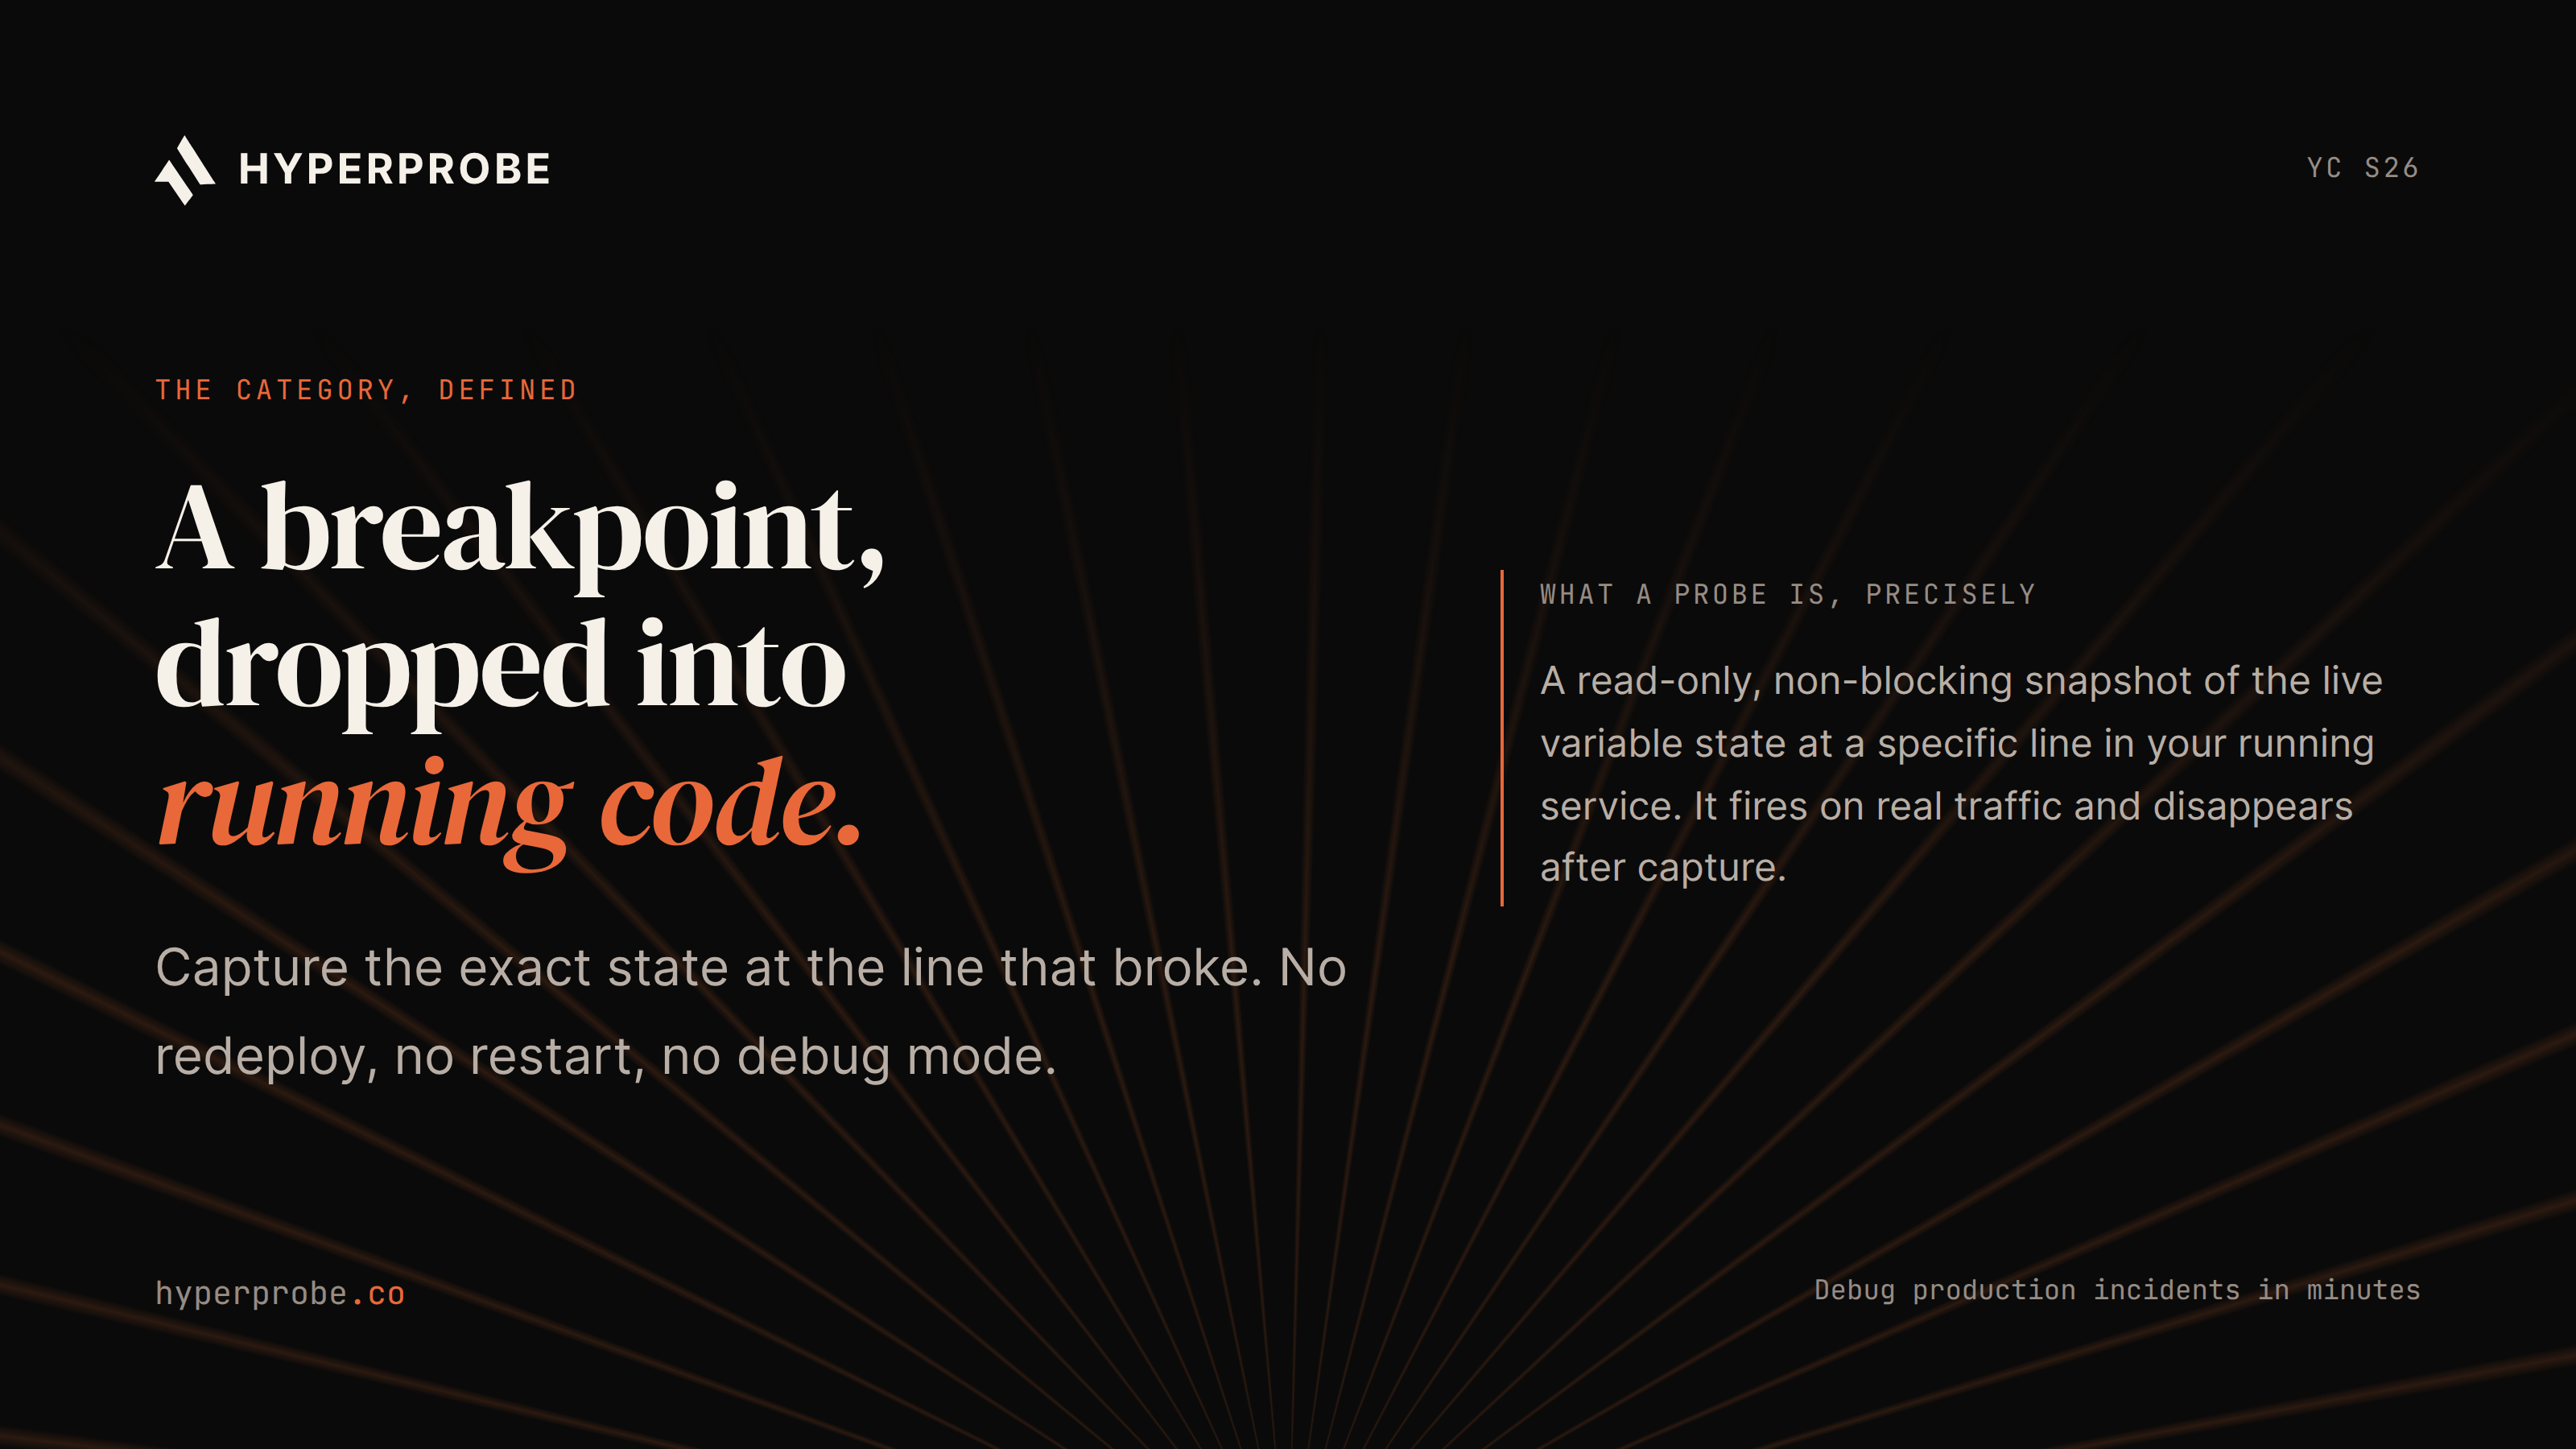
Dynamic instrumentation is the category built for production investigation. It attaches a temporary capture point to a specific line in a service that's already running and reads the state at that line without restarting the process. The implementation differs by language and platform, so the important distinction is operational: a production probe must be non-blocking, bounded, and unable to change application state.
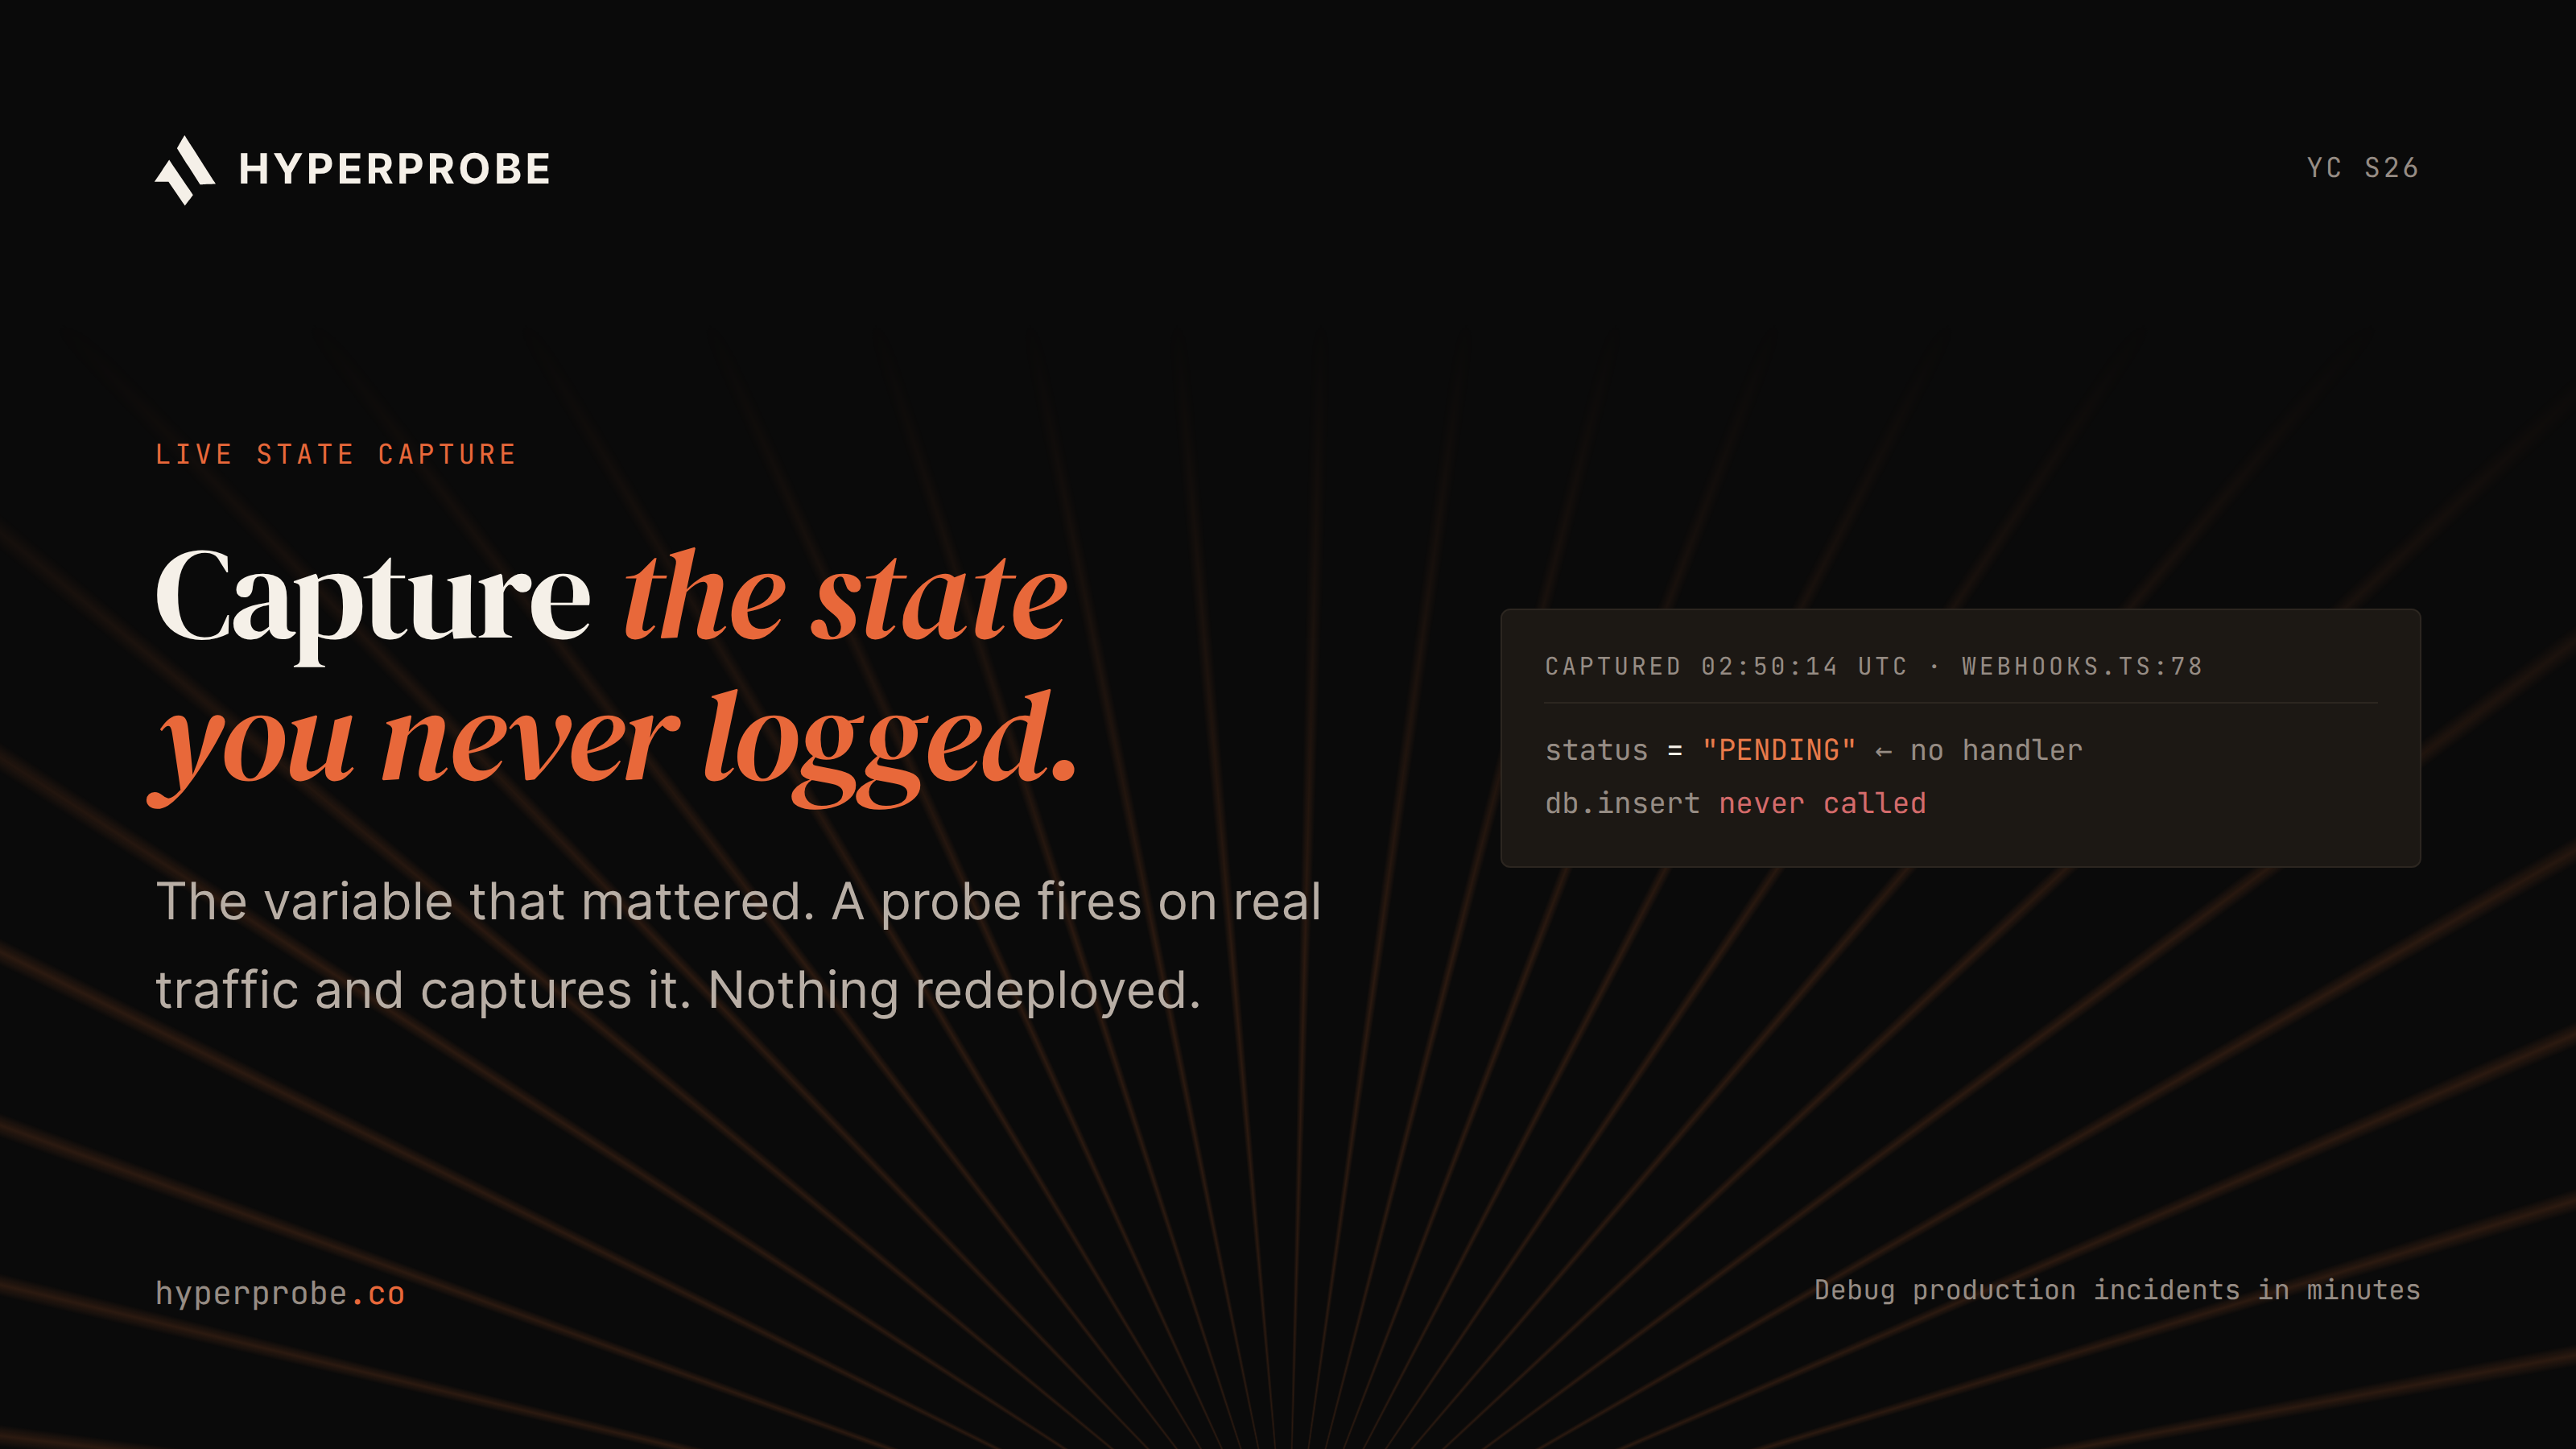
HyperProbe is built for this use case. Its SDK and agent let an engineer place a read-only probe on the suspect line, capture the values present on real traffic, and use that evidence to confirm or reject a root-cause hypothesis without adding a log statement or redeploying the service.
HyperProbe's probe model is non-blocking, and its product safeguards include agent-side PII redaction, immutable audit logs, and private VPC or self-hosted deployment options for environments that require them. The probe is an investigation aid alongside an existing observability stack, not a replacement for logs, metrics, or traces.
Other platforms implement related ideas. Dynatrace's Live Debugger documents non-breaking breakpoints that fetch application data in production, while Datadog's Live Debugger capture points that collect local variables without redeploying or pausing execution.
These examples support the category, but they are not interchangeable: language support, capture limits, redaction behavior, deployment model, and retention controls must be checked for the specific service.
An engineering deep dive into building a non-breaking Python breakpoint found that a naive debugger based on Python's Bdb module was too slow for production use even after optimization. That is a useful warning against treating a normal debugger as a production probe.
A framework for choosing a method
The right method depends on where the failure lives and how much time you have. If the bug reproduces locally and there's no active incident pressure, a debugger or a tracing library gets you the answer with the least setup.
If the bug only shows up under production traffic, doesn't reproduce reliably outside it, or a redeploy carries more risk than the investigation is worth, HyperProbe's read-only probe workflow is the better fit because it is designed to capture evidence from the running service without a new application deploy.
When the missing signal is something you'll want to see again, whether that's a business event, a persistent audit trail, or an error counter that should exist permanently, promote it into a real log line or metric once the immediate investigation is done. A temporary probe answers today's question; a permanent log line prevents tomorrow's version of the same one.
And some failures live outside the code path entirely. A DNS misconfiguration, a load balancer routing rule, or a third-party provider outage can all produce symptoms inside your application while the actual fault sits somewhere no code-level capture can see.
Recognizing that boundary early saves time that would otherwise go into inspecting variables that were never going to explain the problem.
A quick gut check before reaching for any tool: can you name the exact function and line where the value would appear? If the answer is no, spend a few minutes narrowing with existing logs or traces first.
Capturing variables in code works best once you already know roughly where to look, since even a read-only probe needs a specific line to attach to.
What good production capture guardrails look like
Reading state from a live service raises a fair question from whoever owns that service: what happens if this goes wrong? A handful of guardrails answer it.
The capture point should be read-only by design, unable to write memory, execute arbitrary code, or alter the control flow of the request it's attached to. Sensitive fields need automatic redaction before a snapshot ever leaves the host, scrubbing keys that match common patterns like password, token, secret, or authorization by default.
Rate limiting and automatic expiry keep a capture bounded, so a probe set during an incident clears itself rather than running indefinitely. And the capture needs to be checked against the exact commit and version of the code currently running, since a probe mapped to yesterday's build can land on the wrong line entirely after a refactor.
These guardrails are what separate a production-safe capture from a debugger breakpoint that nobody would responsibly point at live customer traffic.
How this fits into root cause analysis
Capturing one variable rarely closes an incident on its own. It's a step inside a larger investigation, and understanding where that step sits helps you use it well. Existing telemetry, logs, traces, and metrics collected in advance narrow the search from an entire system down to a specific function or code path. That's the job application performance monitoring is built for, and it's usually the fastest route from a symptom to a suspect.
The gap opens once tracing has done that job and the trace still can't say why the function returned the wrong thing. A span can show that a call took 480 milliseconds and failed. It can't show which branch executed or what the local variable actually held, because nobody decided in advance to log that specific value.
Capturing the variable is what fills that gap: existing telemetry narrows the search, and a capture on the exact line confirms or rejects the hypothesis with real evidence.
This is also where HyperProbe fits into a broader incident investigation workflow. The platform is intended to help an AI-assisted on-call agent investigate a suspected failure, place a probe where evidence is missing, and confirm the hypothesis from the resulting capture.
That makes HyperProbe an evidence and diagnosis layer alongside an observability stack. Logs, metrics, and traces still provide the system-wide context, while the probe answers the narrower question those signals cannot answer: what did this value contain on the failing execution path? For a closer look at this investigation layer compared with a traditional observability stack, read our guide on AI SRE vs APM.
Turning a one-off capture into a fix
Once the value is captured and the root cause confirmed, the investigation itself shouldn't be the only record of what happened. Decide whether the finding deserves a permanent home: a new log line for the specific field that mattered, a metric that tracks how often the failure condition occurs, or a test that locks in the fix so the same bug can't resurface silently.
A temporary probe did its job by answering the question during the incident. Closing the loop means the next engineer who hits something similar doesn't start from zero.
The shift from guessing to reading
The engineer from the opening didn't need a new deploy. They needed one value, at one line, while the request that exposed the bug was still happening. Whether that comes from a debugger in a local environment or a read-only probe attached to a live service, the underlying shift is the same: stop guessing which log line to add next, and start reading the actual state of the program as it runs.
Teams still spending incident time waiting on deploys to catch a variable that should have been visible from the start have a faster option available now. Book a walkthrough to see a read-only, always-ready capture layer against your own stack.
Frequently asked questions
What is the fastest way to capture a variable that was never logged?
Use a debugger or add a print statement when the bug reproduces reliably outside production. When the missing value exists only in live traffic, HyperProbe's read-only probe workflow can capture it from the running service without waiting for a new application deploy.
Can you inspect a variable in production without redeploying?
Yes. HyperProbe places a temporary, read-only probe on a selected line and captures the variable state from live traffic without restarting the service or shipping a new application deploy. The exact behavior depends on the language, runtime, and capture configuration.
Is print statement debugging safe to use in production?
A print or console statement requires a code change and deployment, can expose sensitive values, and remains active until it is removed. It is usually better suited to development and staging. For production investigations, use a bounded capture method with redaction and expiry controls.
What is dynamic instrumentation?
Dynamic instrumentation adds temporary diagnostic behavior to a running service so engineers can observe state without editing the application and redeploying it. HyperProbe applies this idea through read-only probes that capture selected values at a specific line while the request continues.
How is this different from a normal debugger breakpoint?
A conventional breakpoint can suspend a thread or process until a debugger resumes it, which is risky for live traffic. HyperProbe's probe model is read-only and non-blocking, so it captures bounded evidence while the service continues processing requests.
Written by
Founder
Shailendra Singh is the founder and CEO of HyperProbe (YC S26), an AI on-call agent that debugs production incidents by capturing evidence directly from running services. He has over a decade of experience building and running production systems, starting at Applied Materials before moving into startup operating and engineering leadership roles, including at a company that later became a unicorn. He founded and ran Transporter.city from 2017 to 2021, then spent three years building HyperTest before founding HyperProbe with Karan Raina. He writes about production debugging and incident response.
RELATED READS