What is Dynamic Instrumentation?

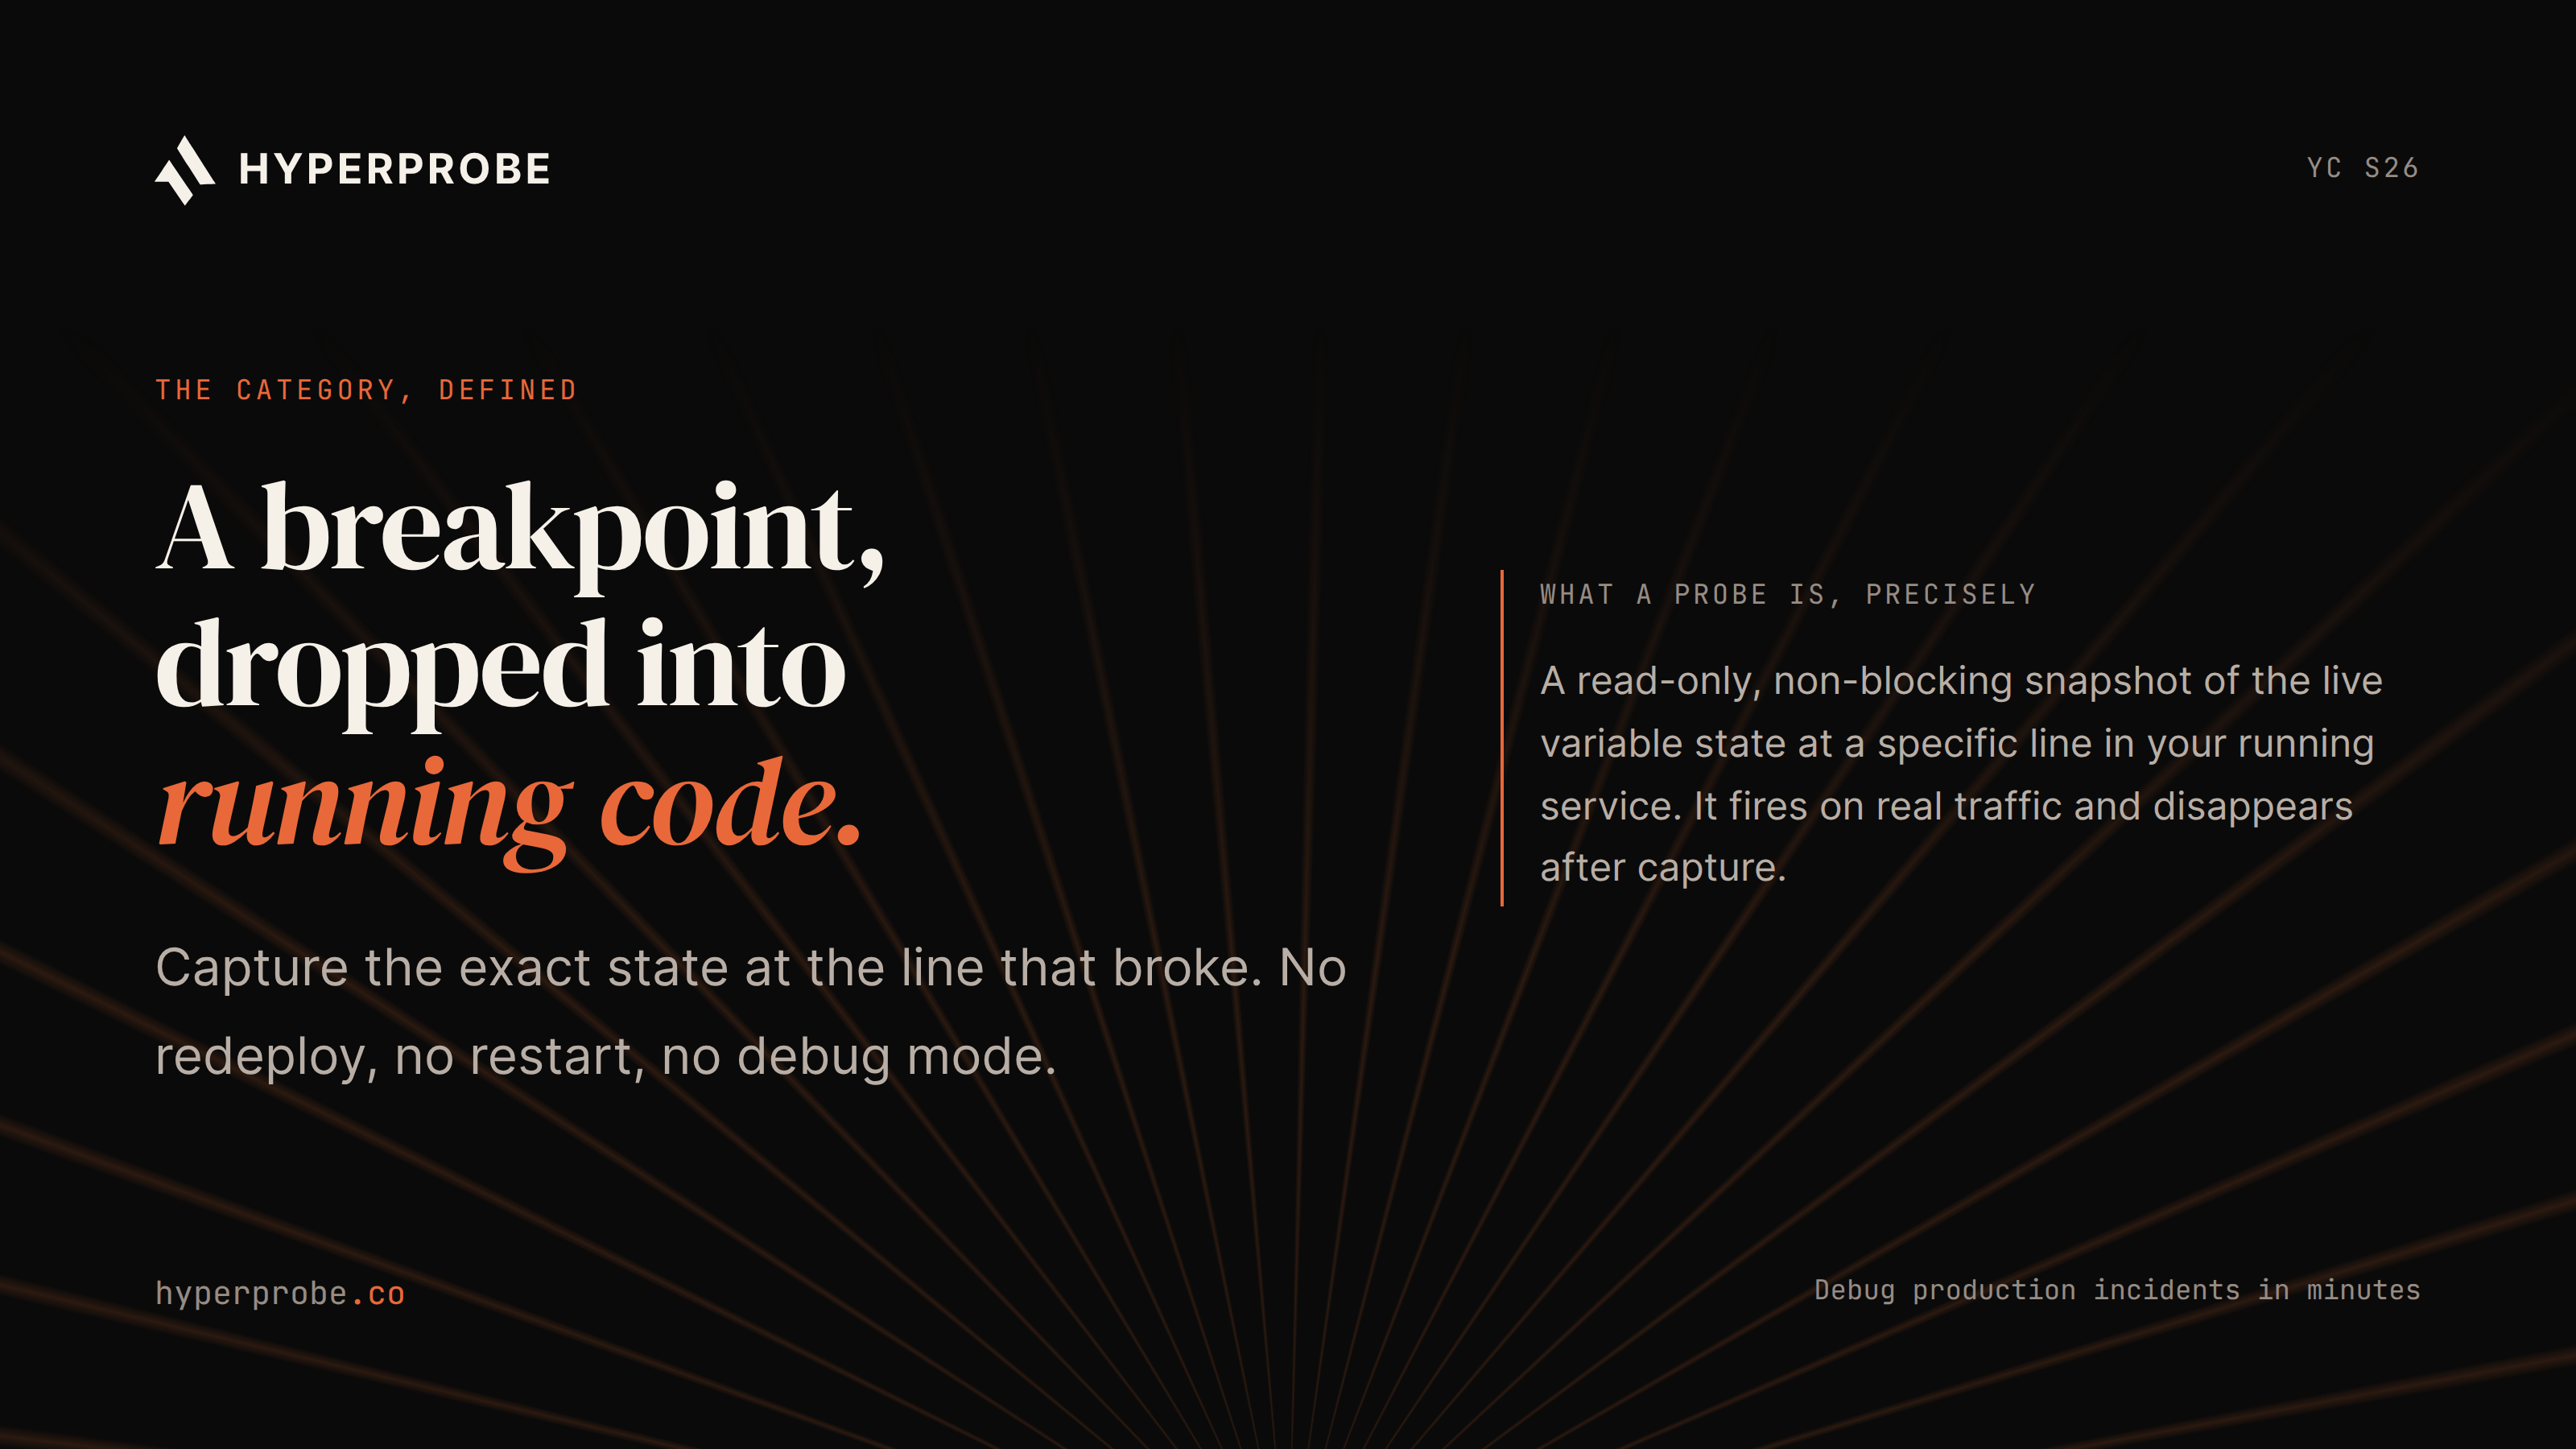
Dynamic instrumentation is the practice of inserting monitoring or capture logic into a program while it is already running, instead of writing that logic into the code ahead of time and shipping it with the next deploy. No recompiling. No restart. An engineer decides, mid-incident, that they need to see a specific value at a specific line, and the running service starts reporting it within minutes.
For an engineering team, that distinction sounds technical. For the person who owns the budget, the roadmap, or the on-call pager escalation, it is closer to a business decision.
Every hour a senior engineer spends adding log lines and waiting on a build pipeline is an hour they are not shipping the product you're trying to grow. Dynamic instrumentation is one of the few DevOps concepts that maps directly to that cost, which is why it is worth understanding even if you never write a line of code yourself.
Static instrumentation vs dynamic instrumentation
The cleanest way to understand dynamic instrumentation is to compare it with its older sibling, static instrumentation.
Static instrumentation is written into the source code ahead of time. A log line, a custom metric, a trace span, all of it gets committed, reviewed, and shipped through the normal release process. Once it's live, it runs on every request that passes through that code path, and it stays there until someone removes it in a future deploy.
Dynamic instrumentation is added after the code is already live, on demand, targeted at a single spot. Nobody has to guess what to log six months before the incident happens. An engineer can look at a failing request right now and decide, in that moment, exactly what they need to see.
Each approach has a real tradeoff worth naming plainly rather than pretending one wins outright.
Static instrumentation gives full coverage of a code path and the lowest possible runtime overhead, because the instructions are baked in and optimized at build time. Its cost shows up earlier: changing what gets captured means opening a pull request, waiting for a build, and redeploying.
Dynamic instrumentation skips all of that to attach or remove a capture. In exchange, it only sees the requests that hit the instrumented line while the capture is active, and every attached probe adds a small runtime cost of its own while it runs.
Neither approach replaces the other. Most mature engineering teams run both: static instrumentation for the metrics and traces they always want, dynamic instrumentation for the specific question that only comes up once an incident is already underway.
How dynamic instrumentation works under the hood
You don't need to understand a compiler to grasp the mechanics, but the shape of it matters because it explains why this is possible without a redeploy.
The service has to be instrumented in advance with an agent or SDK, that part doesn't skip the setup step. What changes is what happens after that. Once the agent is running inside the process, it can accept new instructions on the fly, typically pushed down from a dashboard, a CLI command, or an API call, telling it where to attach a capture point next.
The exact hook depends on the language. On the JVM, this usually means bytecode instrumentation: the agent inserts an observation point around the target method or line and intercepts execution just long enough to copy the state that was requested.
Modern Python versions ship a purpose-built API for this called sys.monitoring, designed for exactly this kind of low-overhead runtime observation. Other languages use whatever hook their runtime exposes for the same purpose.
There's a second, lower-level version of this idea that operates outside any single application. eBPF, a Linux kernel technology, lets small sandboxed programs attach to kernel-level events, system calls, network packets, process scheduling, without touching the application's source code at all.
Tools built on eBPF, such as Grafana Beyla and the OpenTelemetry eBPF Instrumentation project, use this to auto-instrument services across languages the SDK-based agents can't always reach.
A capture request typically looks something like this in shape, whatever the exact vendor syntax:
location:
  file: checkout_service.py
  method: authorize_payment
  line: 142
capture:
  locals: [payment_method, retry_count]
  condition: "retry_count > 2"
  expires_in_minutes: 30
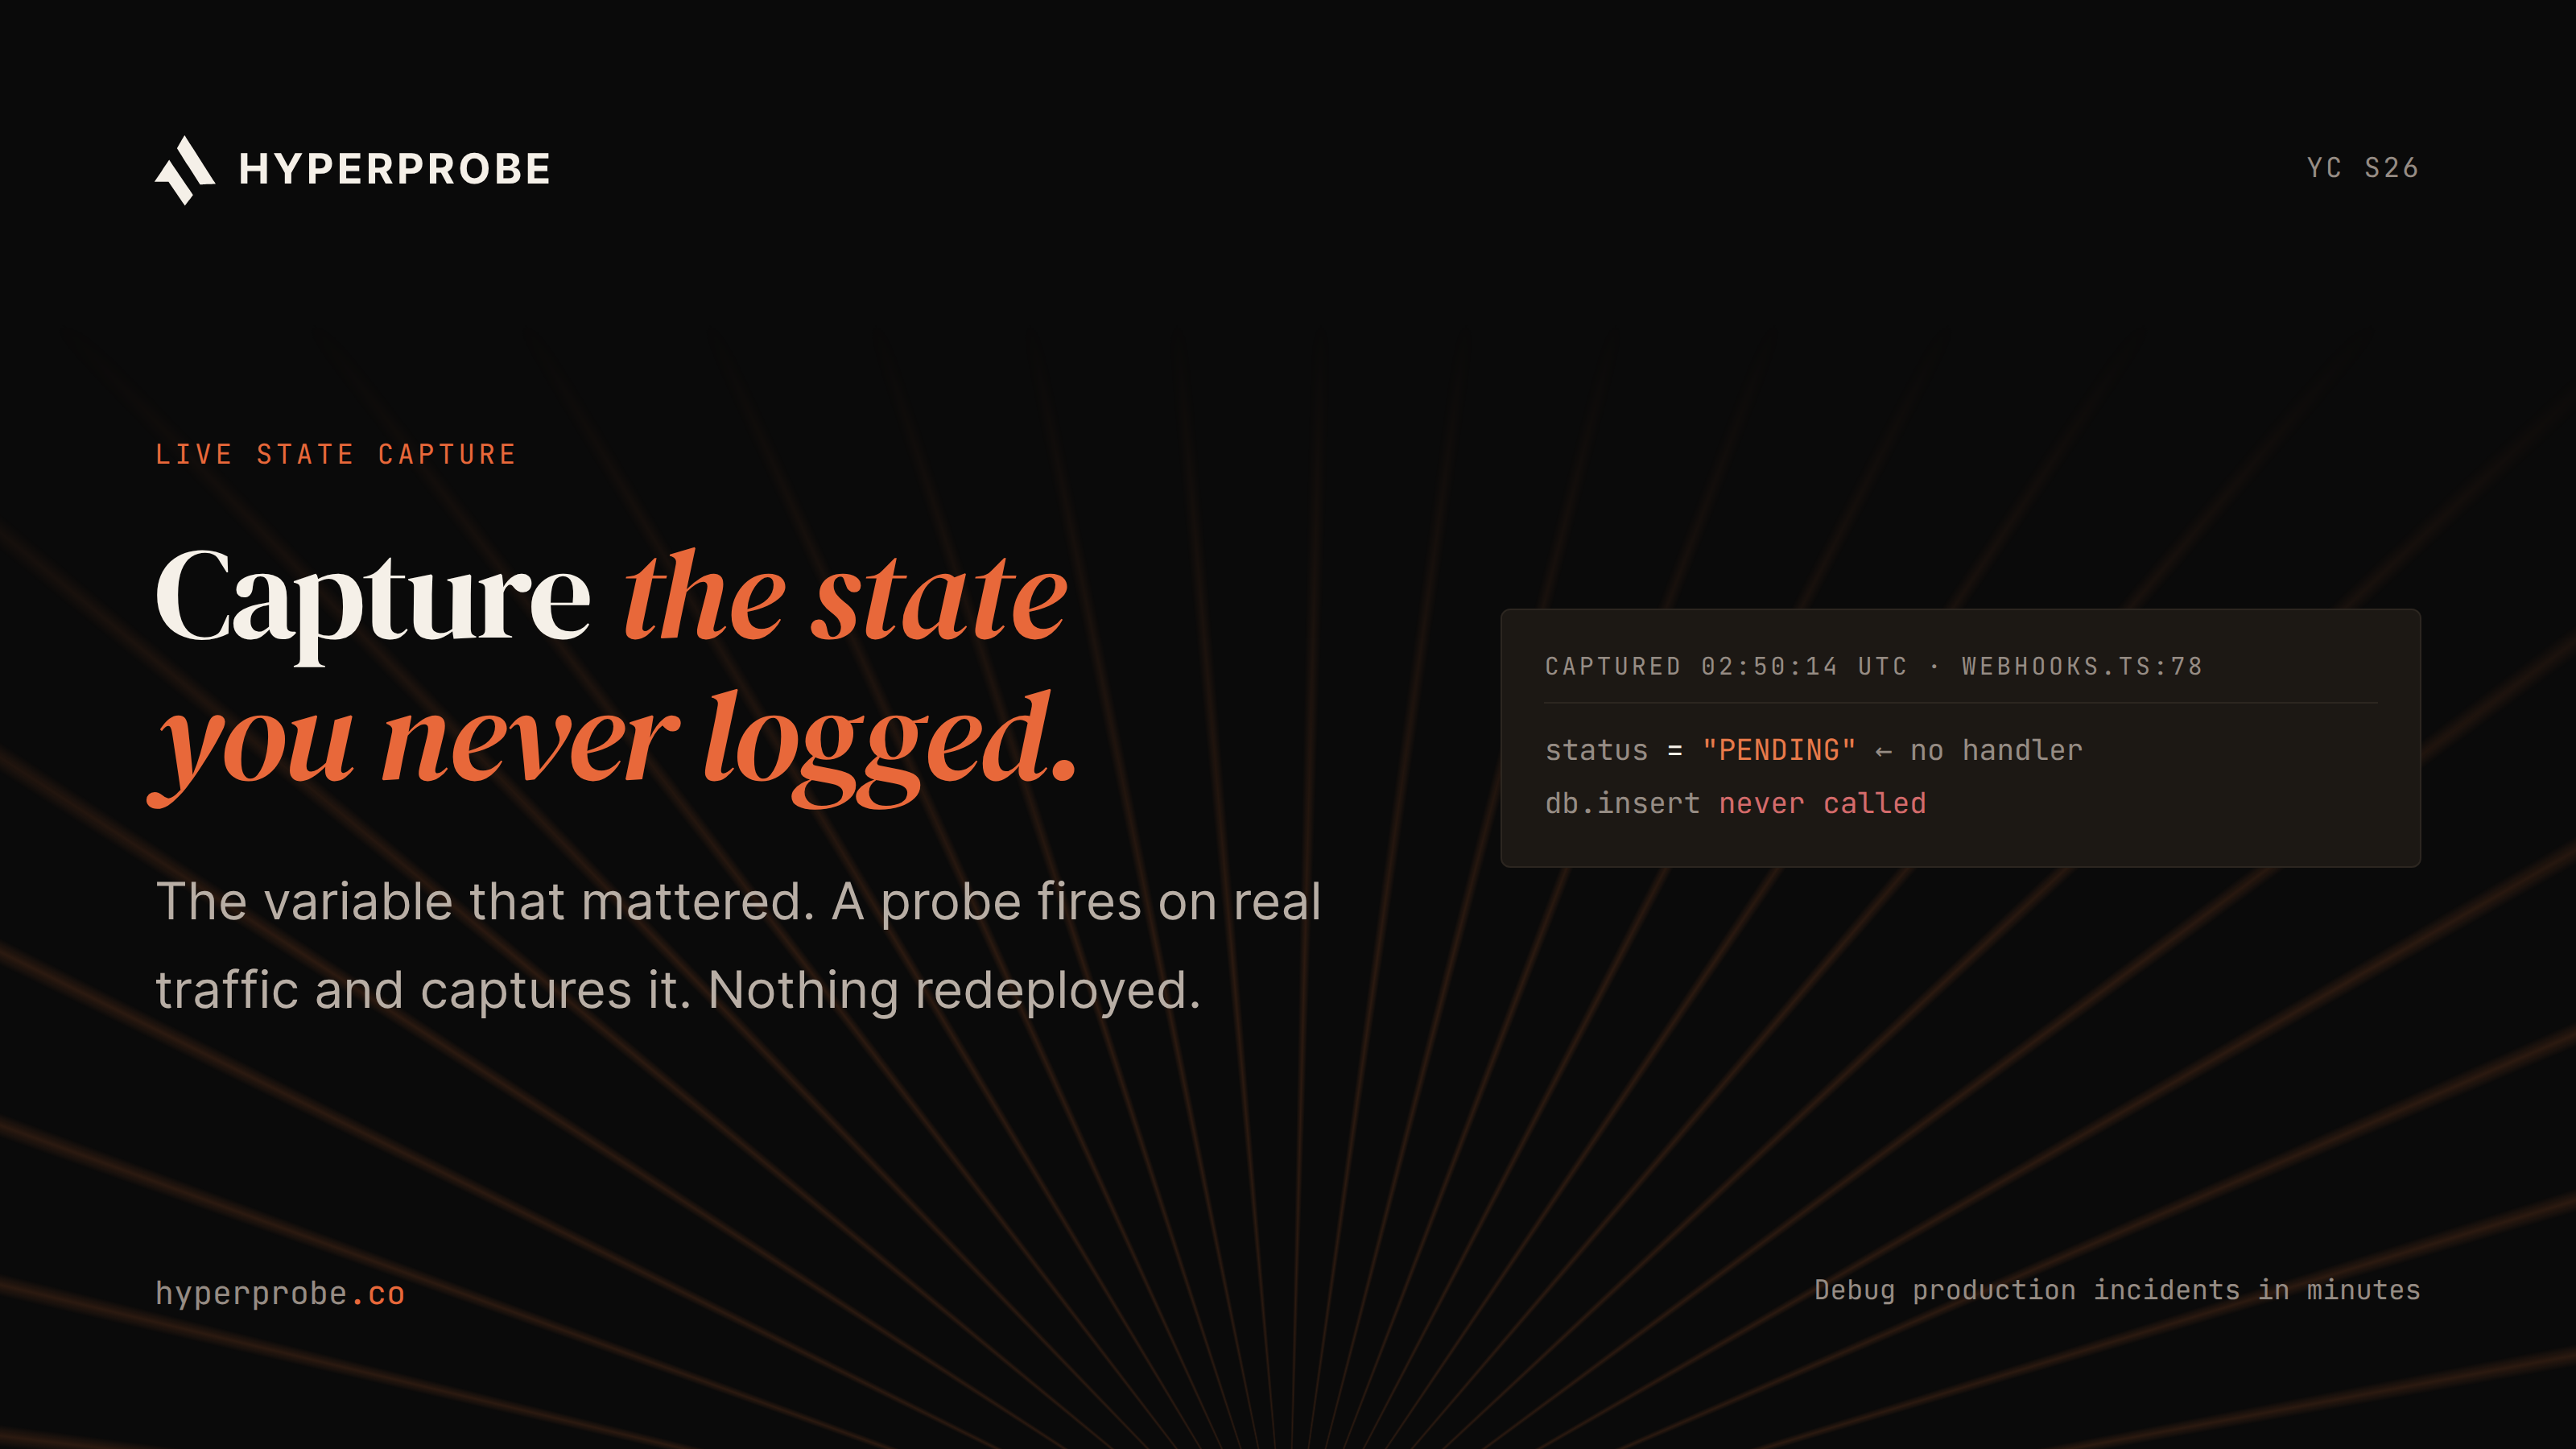
That configuration gets pushed to the already-running agent, which starts watching that exact line. The next request that reaches it, and matches the condition, triggers the capture. Nothing about the process restarts.
Why engineering teams reach for it
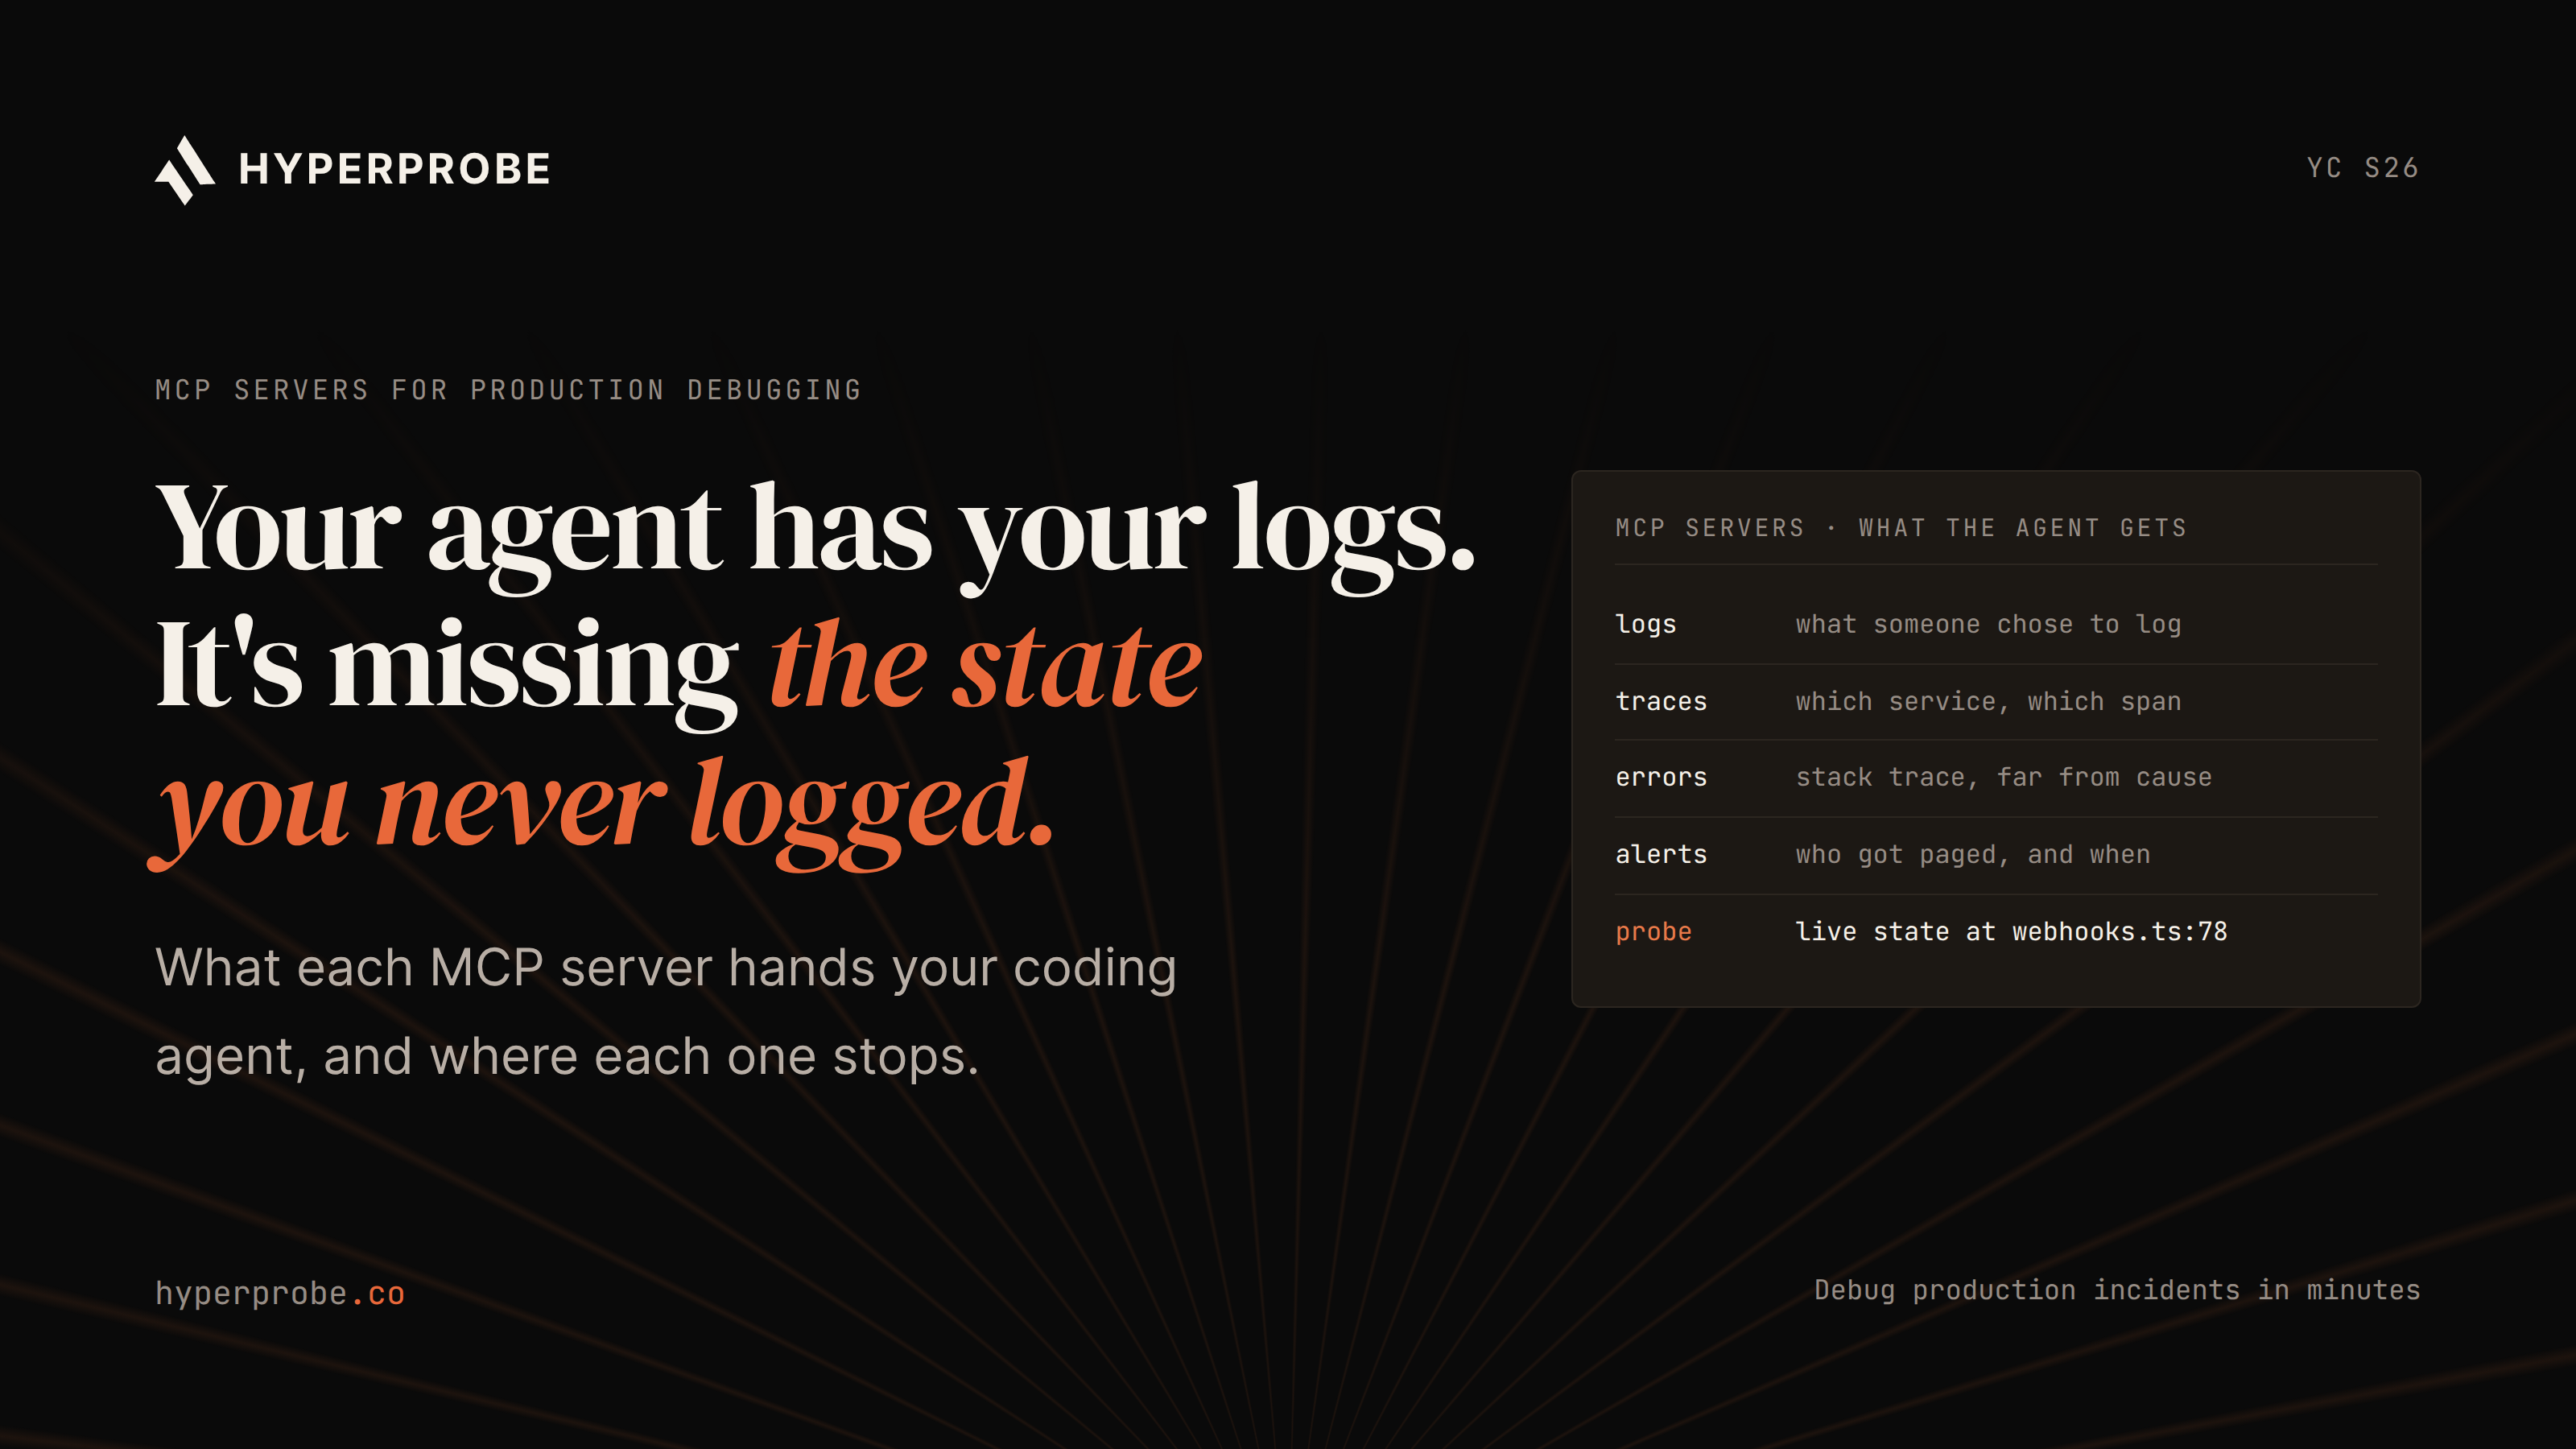
The reason this matters commercially starts with a familiar incident story. A request fails in production. The stack trace names a function, the trace shows a slow call and a 500 response, and none of it explains the actual cause, because the one variable that would explain it was never written to a log.
The instinctive fix is to add a log line. That means opening a pull request, waiting for a teammate to review it, waiting for CI to run, building a new artifact, and rolling it out.
A single redeploy cycle commonly costs thirty minutes to a few hours depending on the pipeline, and the team often pays that cost more than once, because the first log line captures the wrong value or the bug doesn't reproduce on the next attempt.
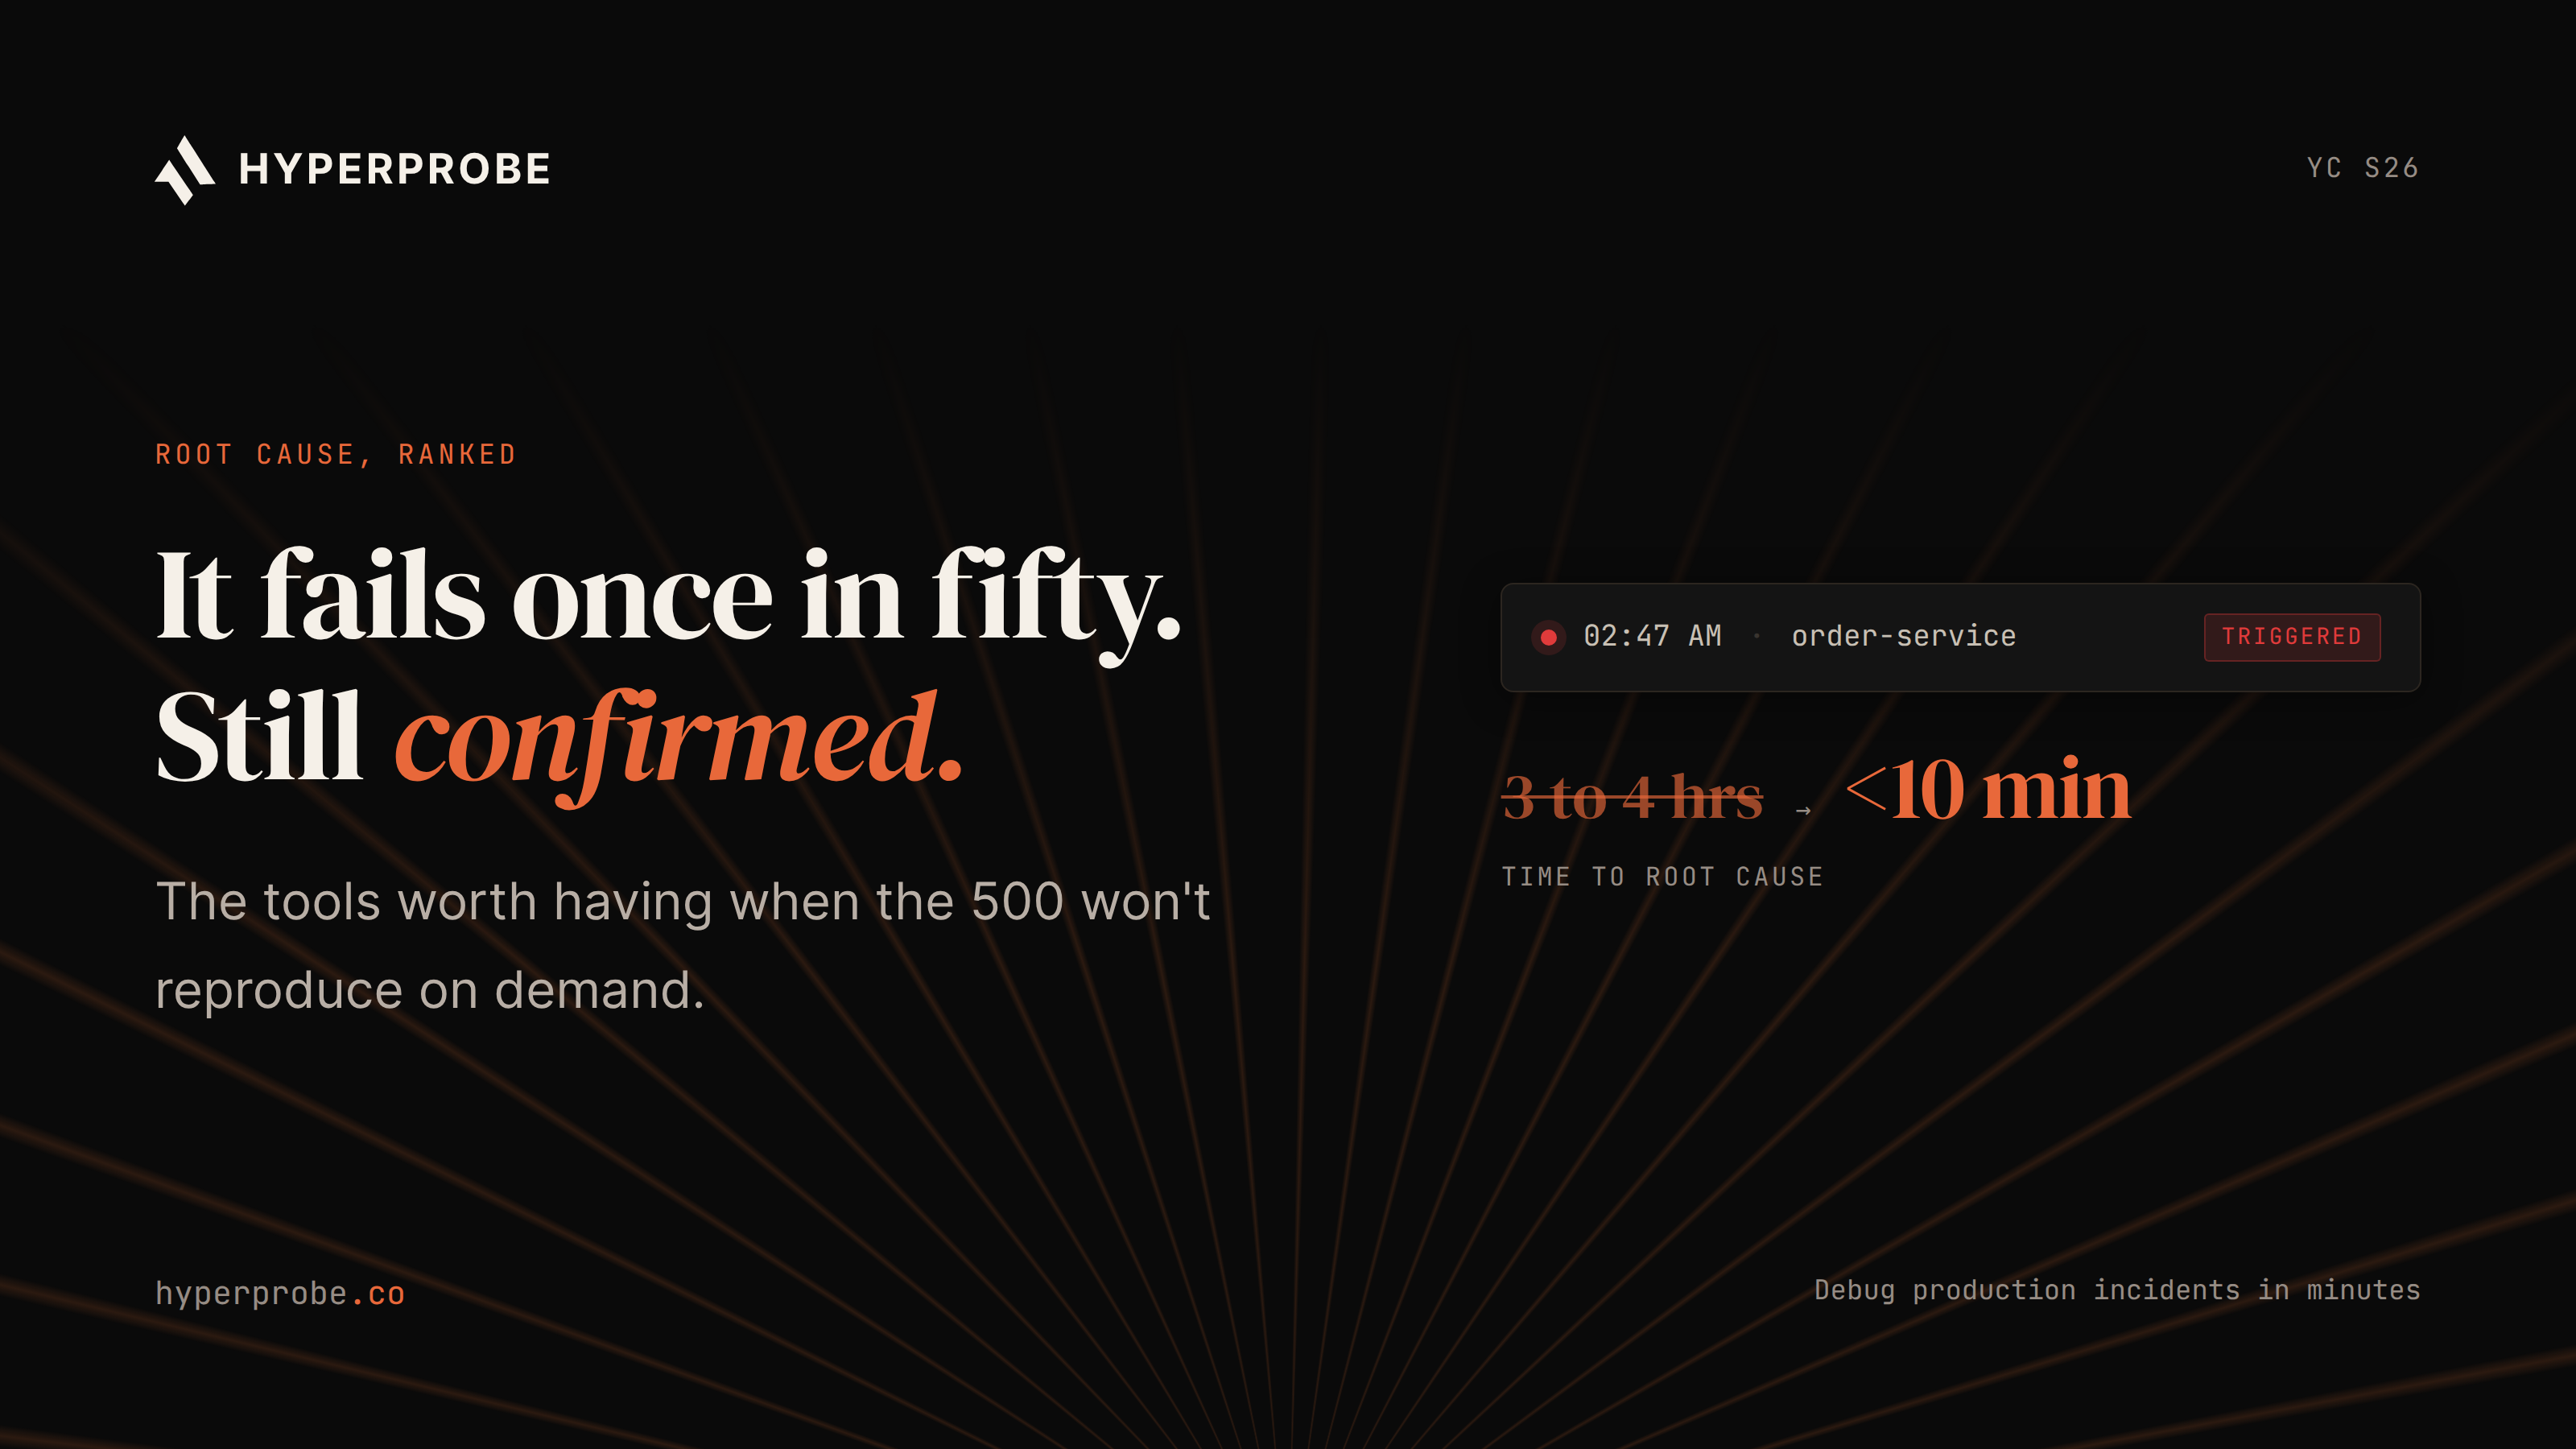
An incident that should have taken ten minutes stretches into hours of a senior engineer waiting on a build pipeline instead of reading data.
Dynamic instrumentation removes the redeploy step from that loop entirely. The capture attaches to code that's already running, the next matching request triggers it, and the engineer reads a structured snapshot instead of grepping through a log file for a value that was never there.
For a leadership team, the value shows up as a metric worth tracking: how much of your senior engineering capacity goes to incident investigation versus the roadmap, and how many of those hours are actually just waiting on deploy pipelines.
Where dynamic instrumentation shows up in practice
Teams typically encounter dynamic instrumentation through one of two paths, and it's worth knowing both exist because they solve slightly different problems.
The first is user-space agents that operate inside the boundary of a single application. Java agents can dynamically load bytecode into a running JVM. Python's tracing hooks intercept function calls and returns from within the interpreter.
Datadog ships this as a named product, Dynamic Instrumentation and its companion Live Debugger, which lets an engineer attach a logpoint, an auto-expiring, non-breaking capture, to a running service and read variable values, method arguments, and execution context without a redeploy.
Lightrun offers a similar model, attaching logs, snapshots, and metrics through a runtime agent in a sandboxed, read-only mode with automatic cleanup after the investigation ends.
The second path is kernel-level, using eBPF to watch system calls and network traffic without ever touching application source code. This is what powers zero-code auto-instrumentation tools like Grafana Beyla, which attaches uprobes and kprobes to a running binary to capture RED metrics and trace spans across languages, even ones the language-specific SDKs don't cover.
Both paths answer the same underlying need, seeing what a running system is actually doing, at different layers of the stack.
The risk nobody mentions in the demo
None of this is free, and it's worth saying plainly rather than glossing over it. Every attached probe adds a real cost: CPU cycles, memory access, cache invalidation, and in some cases meaningful latency.
One field account from an observability practitioner describes a Kafka consumer investigation where eBPF tracing surfaced a subtle race condition, a genuine win, but reported that the same instrumentation dropped system performance by roughly 30% while it ran.
The same account describes a Python service where a tracing agent's overhead, combined with the logging it produced, caused a cascading failure as downstream services timed out waiting on a suddenly slower upstream call. Treat the specific percentage as one team's field experience rather than a universal benchmark, the direction of the risk holds regardless of the exact number.
The lesson isn't to avoid dynamic instrumentation. It's to scope it deliberately. Rate limits, capture size limits, conditions that only fire the probe for a specific input, and automatic expiry all keep a capture bounded to the exact question being asked, rather than left running indefinitely against every request.
What makes dynamic instrumentation production-safe
The tools worth trusting on live traffic build that safety into the architecture rather than leaving it as a setting someone can forget to configure.
Four guardrails matter most. The capture point should be read-only by design, incapable of writing memory, executing arbitrary code, or altering control flow, so it can't become the thing that causes the very incident it was meant to diagnose.
Every capture should be bounded automatically, by a rate limit, a maximum hit count, and a time to live, so it clears itself without anyone needing to remember to remove it. Sensitive fields such as passwords, tokens, and authorization headers should be redacted before a snapshot ever leaves the host, not after.
And the capture should be checked against the exact commit a service is running, so a probe never gets evaluated against a version of the function that no longer exists.
HyperProbe's live production debugging follows this exact model: read-only probes that self-clear on a time limit and rate limit, PII redacted at the agent before capture, and commit SHA alignment enforced before a probe can attach at all.
Dynamic instrumentation and your existing observability stack
A fair question from anyone evaluating this space: does adopting dynamic instrumentation mean replacing the APM or tracing tool you already pay for? No. It picks up work that logs, metrics, and traces were never designed to do.
Application performance monitoring shows what happened across a system, in advance, because someone decided what to collect before the incident occurred. It's excellent at narrowing a problem down to a specific service, route, or function.
What it can't do is show you a value that nobody thought to log, because that data simply was never captured. Dynamic instrumentation is the on-demand step that runs after tracing has done its job, sitting alongside the observability stack a team already runs rather than replacing it, once the trace has pointed at the right function but still can't say why it returned the wrong thing.
What to ask before you buy or build it
A short set of questions cuts through most vendor pitches quickly when your team is evaluating dynamic instrumentation, whether as a standalone capability or as part of a broader incident response purchase.
- Does attaching a capture require a redeploy, or does it work against the process that's already running?
- Is sensitive data redacted before it leaves your infrastructure, or does raw application state travel to a third party unfiltered?
- Do captures expire on their own, or does someone have to remember to remove them once the investigation ends?
- Does it actually support the languages and runtimes your production stack is built on?
The answers to those four questions will tell you more about whether a tool is production-ready than any feature list.
Bringing it back to the incident
Dynamic instrumentation exists to answer one narrow but expensive question: what was this specific piece of code actually doing when it failed, right now, without a rebuild standing between the question and the answer. That's a technical capability with a direct line to a business outcome, fewer redeploy cycles, less senior engineering time lost to guesswork, and incidents that close with a confirmed cause instead of an educated guess that might resurface next week.
Teams still burning hours on the log-redeploy-wait cycle every time production breaks in an unexpected way have a reason to see what a read-only, self-expiring capture layer looks like against their own stack. Book time with the HyperProbe team to learn more.
Frequently asked questions
Is dynamic instrumentation the same as a debugger?
No. A traditional debugger pauses an entire thread or process until a person resumes it, which is why nobody runs one against live customer traffic. Dynamic instrumentation attaches a temporary, read-only capture point to a specific line, copies the requested state the next time that line executes, and lets the request continue immediately without pausing anything.
Does dynamic instrumentation require redeploying code?
No. The service needs an agent or SDK installed in advance, but attaching a new capture point after that doesn't require a rebuild or restart. The agent already running inside the process accepts the new instruction, typically through a dashboard, CLI, or API call, and starts watching the target line within minutes.
What is the difference between dynamic instrumentation and eBPF?
Dynamic instrumentation is the general practice of adding observation logic to running code. eBPF is one specific mechanism for doing it at the Linux kernel level, letting sandboxed programs attach to system calls, network events, and process scheduling without touching application source code. User-space agents (Java bytecode instrumentation, Python's sys.monitoring) are the application-level equivalent of the same idea.
Is dynamic instrumentation safe to run on production traffic?
It can be, when the tool is built for it. The safest implementations are read-only by design, so a capture cannot write memory, execute code, or alter control flow. They also bound every capture with a rate limit, a maximum hit count, and an automatic expiry, and redact sensitive fields before any snapshot leaves the host.
Does dynamic instrumentation replace logging and APM?
No. Logs, metrics, and traces still do the job of showing what happened across a system based on what was collected in advance. Dynamic instrumentation is the on-demand step that runs after that telemetry has narrowed an incident to a specific function, capturing the one value that was never logged in the first place.
Written by
Founder
Shailendra Singh is the founder and CEO of HyperProbe (YC S26), an AI on-call agent that debugs production incidents by capturing evidence directly from running services. He has over a decade of experience building and running production systems, starting at Applied Materials before moving into startup operating and engineering leadership roles, including at a company that later became a unicorn. He founded and ran Transporter.city from 2017 to 2021, then spent three years building HyperTest before founding HyperProbe with Karan Raina. He writes about production debugging and incident response.
RELATED READS