Best tools for root cause analysis of intermittent 500 errors


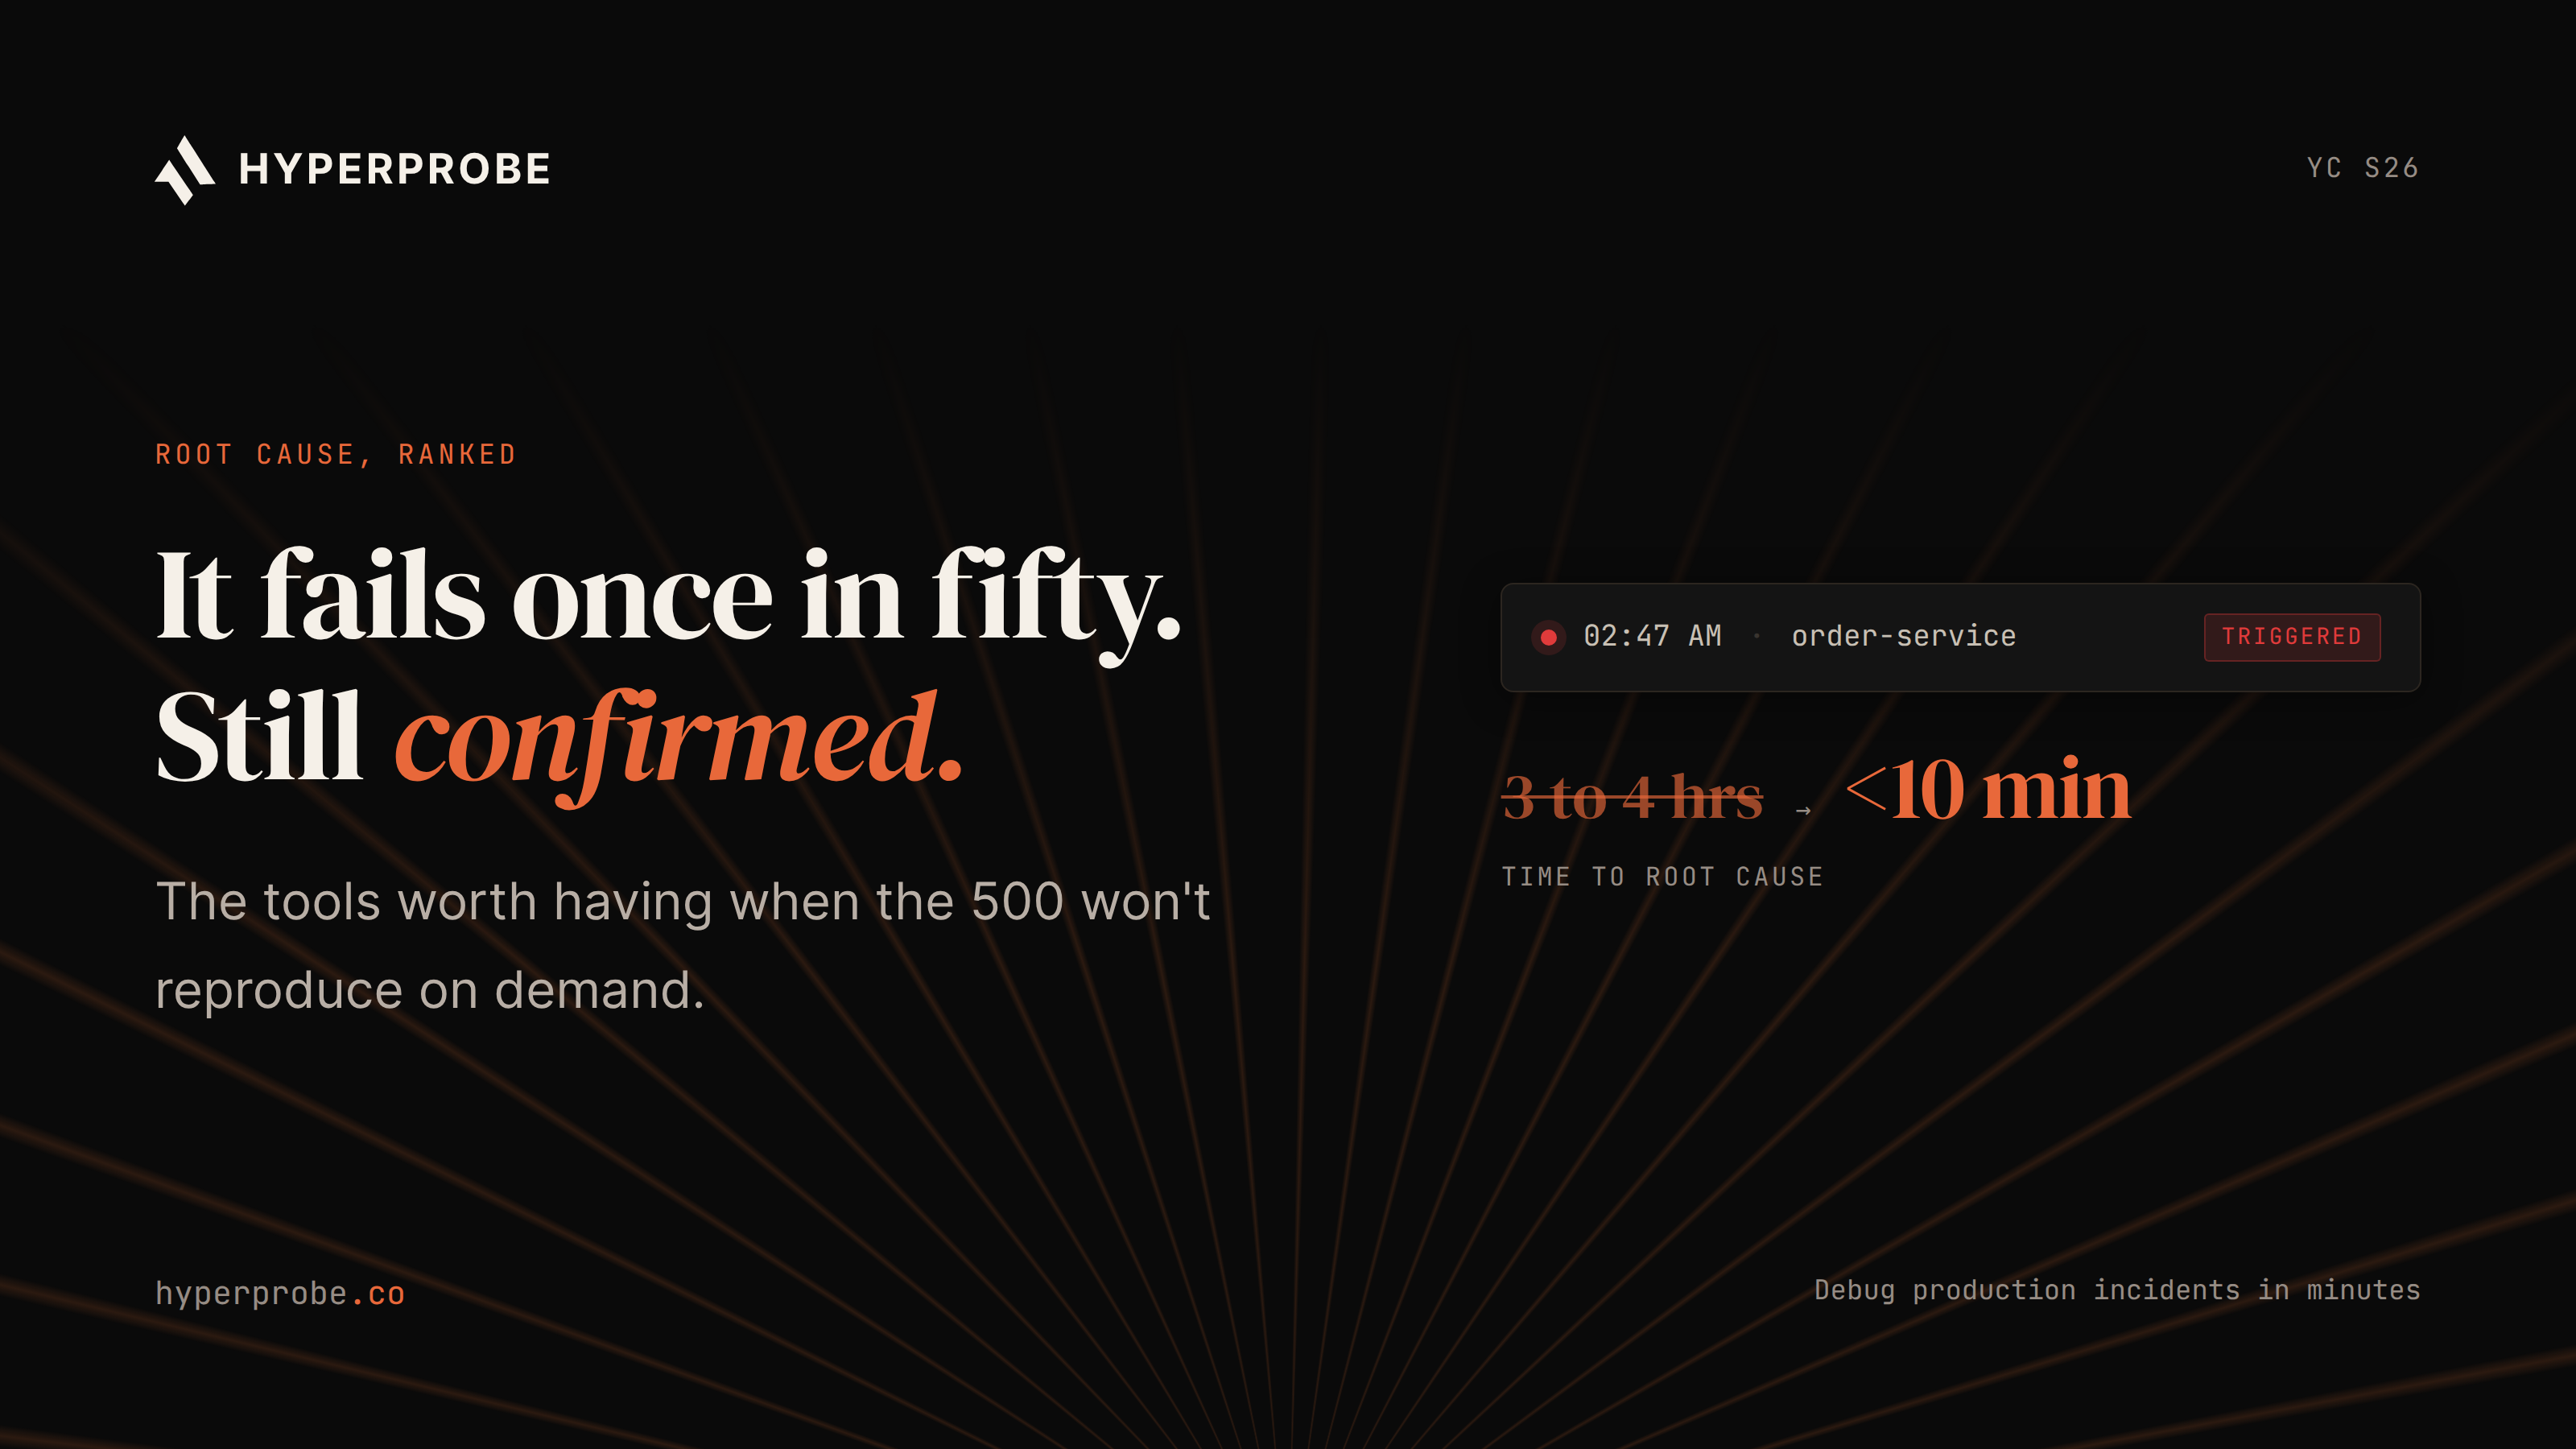
An intermittent 500 error is the incident every on-call engineer dreads more than an outright outage. The service is technically up. The dashboards look mostly green. Then, for one request in a thousand, something breaks, and by the time anyone opens a terminal to look, the evidence is gone.
Root cause analysis tools capture and correlate evidence so teams can fix the cause rather than the visible symptom.
This guide explains why intermittent 500s resist normal debugging, how root cause analysis tools compare, and how to build an evidence-first workflow for the next incident.
Quick answer
The best root cause analysis tool for an intermittent 500 error depends on the evidence your stack is missing. Datadog and New Relic correlate application, infrastructure, and deployment signals; Sentry explains application exceptions; Honeycomb helps investigate high-cardinality events; PagerDuty coordinates response; and HyperProbe captures runtime evidence when the failed request cannot be reproduced. In practice, teams often combine these categories rather than replace their existing observability platform.
Why intermittent 500 errors break normal debugging
A reproducible bug is a gift. You run the request again, watch it fail the same way, and step through it with a debugger. Intermittent 500s don't offer that. The request that failed is gone by the time an engineer opens a dashboard, and running it again usually succeeds, because the conditions that caused the failure were transient in the first place.
Common causes include connection-pool exhaustion, downstream timeouts, uncaught exceptions tied to a specific input or feature-flag cohort, resource limits, and configuration drift. These conditions can disappear before an engineer begins investigating.
Vercel's guide to debugging production 500 errors recommends narrowing structured 5xx logs to the failure window, identifying the serving deployment, and checking recent commits. Tracekit and StatusCodeFYI add a key requirement: a correlation ID and enough request context to reconstruct what happened across services. Without that evidence, engineers are left guessing after the request disappears.
Root cause analysis tool categories
Root cause analysis tools fall into several layers. Each solves a different part of the investigation, so the right choice depends on whether the missing capability is telemetry, runtime context, incident coordination, or evidence-based diagnosis.
Log management
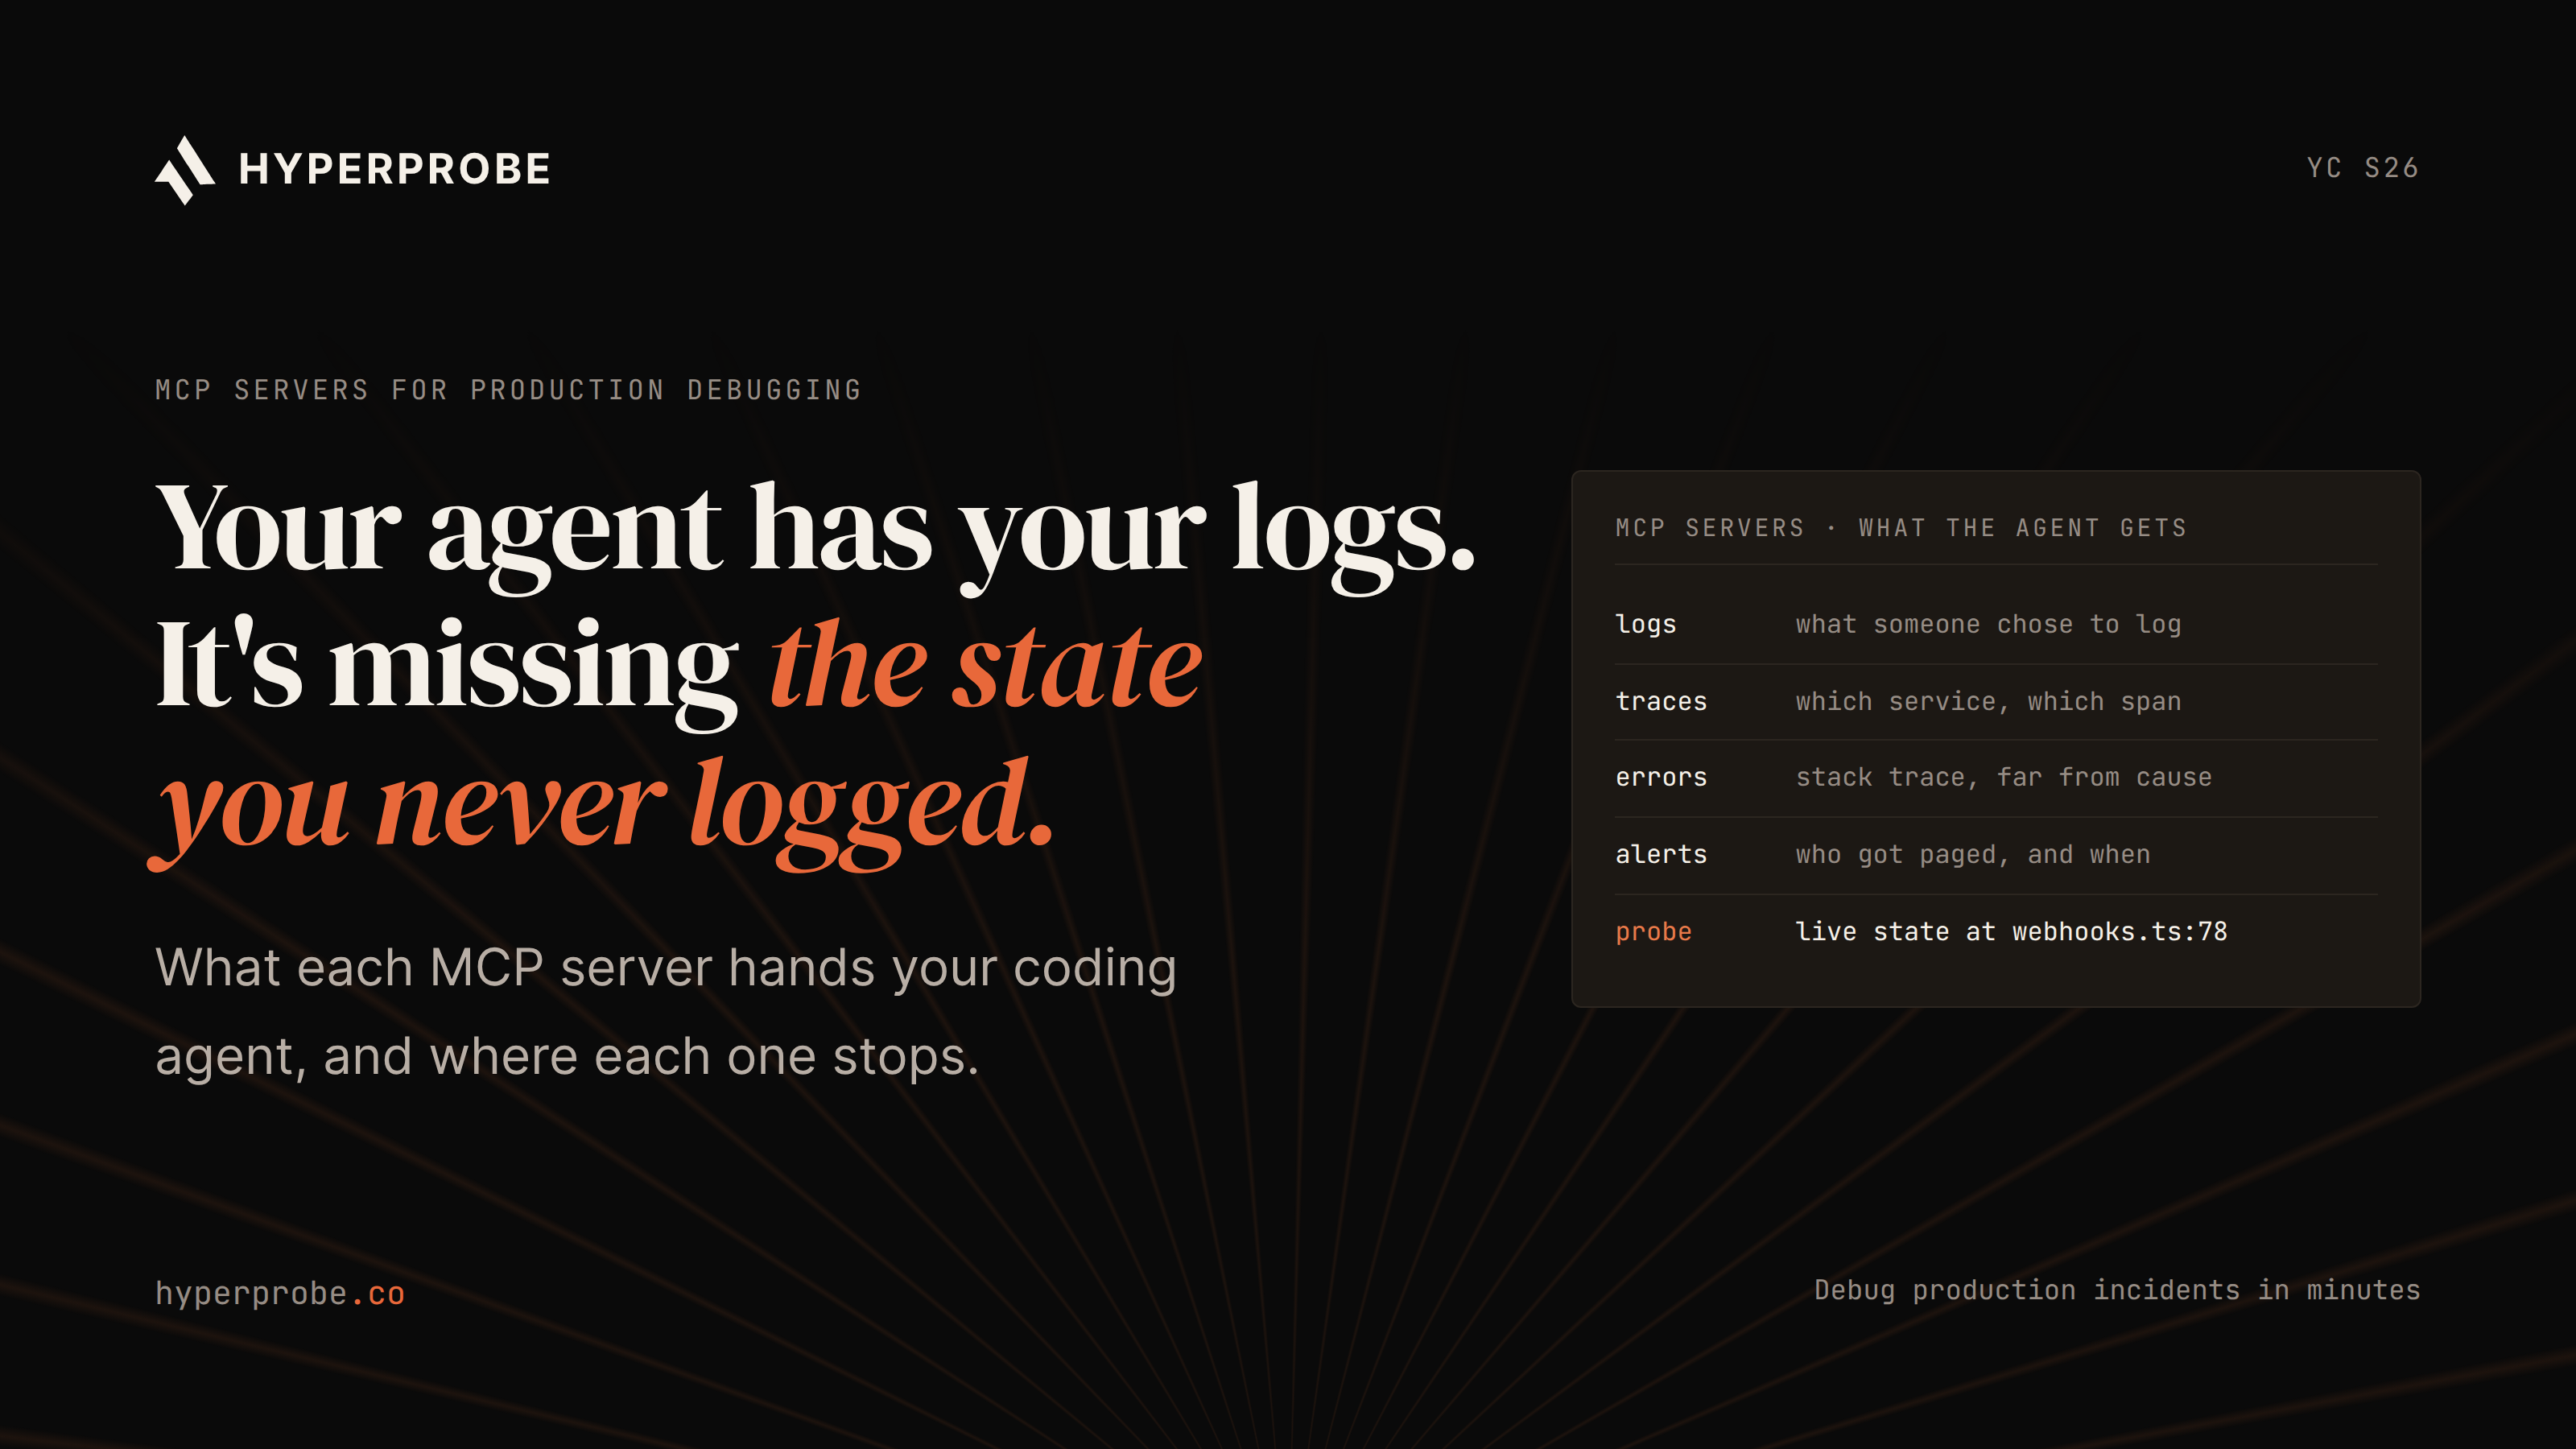
The ELK stack and Grafana Loki provide searchable application logs, error trends, and time-window filtering. They are a baseline for production teams, but can reveal only the state the application recorded. That may exclude the variable values, dependency response, or resource pressure behind an intermittent 500.
Distributed tracing
Jaeger, Grafana Tempo, and OpenTelemetry-based platforms follow a request across services and show where latency or errors entered the path. Tail-based sampling can retain failed traces, while comparing a failing request with a healthy request on the same route often reveals the first point of divergence. Research on debugging microservices with distributed tracing supports this approach.
Tracing is valuable when the question is “which service failed?” It may still leave the harder question unanswered: “Which runtime condition made that service fail?”
APM and observability platforms
Datadog, New Relic, and Honeycomb combine metrics, logs, traces, infrastructure data, and change events. This breadth helps when a 500 overlaps with a slow database, saturated worker pool, or recent deployment, but correlation still requires judgment and may not reveal missing runtime state.
Error monitoring
Sentry focuses on application exceptions, stack traces, breadcrumbs, releases, and ownership. It fits code-level exceptions where the team needs to identify the affected release or route quickly.
Session replay adds user context, and Seer can assist with investigation. Sentry is less complete when the cause sits outside the exception, such as a saturated connection pool, infrastructure limit, or dependency timeout.
Incident response
PagerDuty handles alert routing, escalation, on-call schedules, and response coordination. Its advantage is operational: it helps the right person receive and manage an incident. It does not replace an observability or root cause analysis system, because paging an engineer does not explain why the request failed.
PagerDuty belongs in the incident workflow, alongside a tool that can gather and interpret technical evidence.
AI-driven incident investigation
AI incident investigation tools sit between observability data and the engineer who must make a decision. HyperProbe belongs in this category because its proprietary SDK and read-only probes capture runtime evidence from the relevant code path, helping engineers investigate a failure that may never reproduce. O
ther products in this category include Lightrun and Resolve AI. The useful products correlate telemetry, changes, and past incidents, then produce a hypothesis with evidence that an engineer can verify. The important distinction is whether the product investigates the failure or only summarizes existing dashboards.
Top 7 Tools for intermittent 500 errors by use case
| Tool or category | Best fit | Strongest signal | Main limitation |
|---|---|---|---|
| HyperProbe | Runtime evidence capture | Variable state and code-path context | Needs SDK instrumentation and a separate observability layer |
| Datadog | Unified observability | Logs, traces, metrics, and infrastructure events | May not capture the variable state behind one failed request |
| Sentry | Application exceptions | Stack traces, releases, and error context | Less complete for infrastructure or dependency failures |
| New Relic | Transaction-level APM | Request paths, spans, and dependencies | Usage-based costs need careful modeling |
| Honeycomb | High-cardinality investigation | Tenant, region, route, and feature-flag patterns | Depends on useful attributes being captured in advance |
| Lightrun | Live code-path diagnostics | Targeted runtime observations | Requires strict controls for live diagnostics and data exposure |
| PagerDuty | Incident coordination | Routing, escalation, and on-call state | Does not investigate the technical cause |
Use the table as a starting point, not a substitute for a security, integration, and pricing review. The comparison weighs telemetry depth, runtime capture, integrations, security controls, and operating fit. These platforms solve different parts of the investigation, and several are complementary.
1. HyperProbe for runtime evidence capture
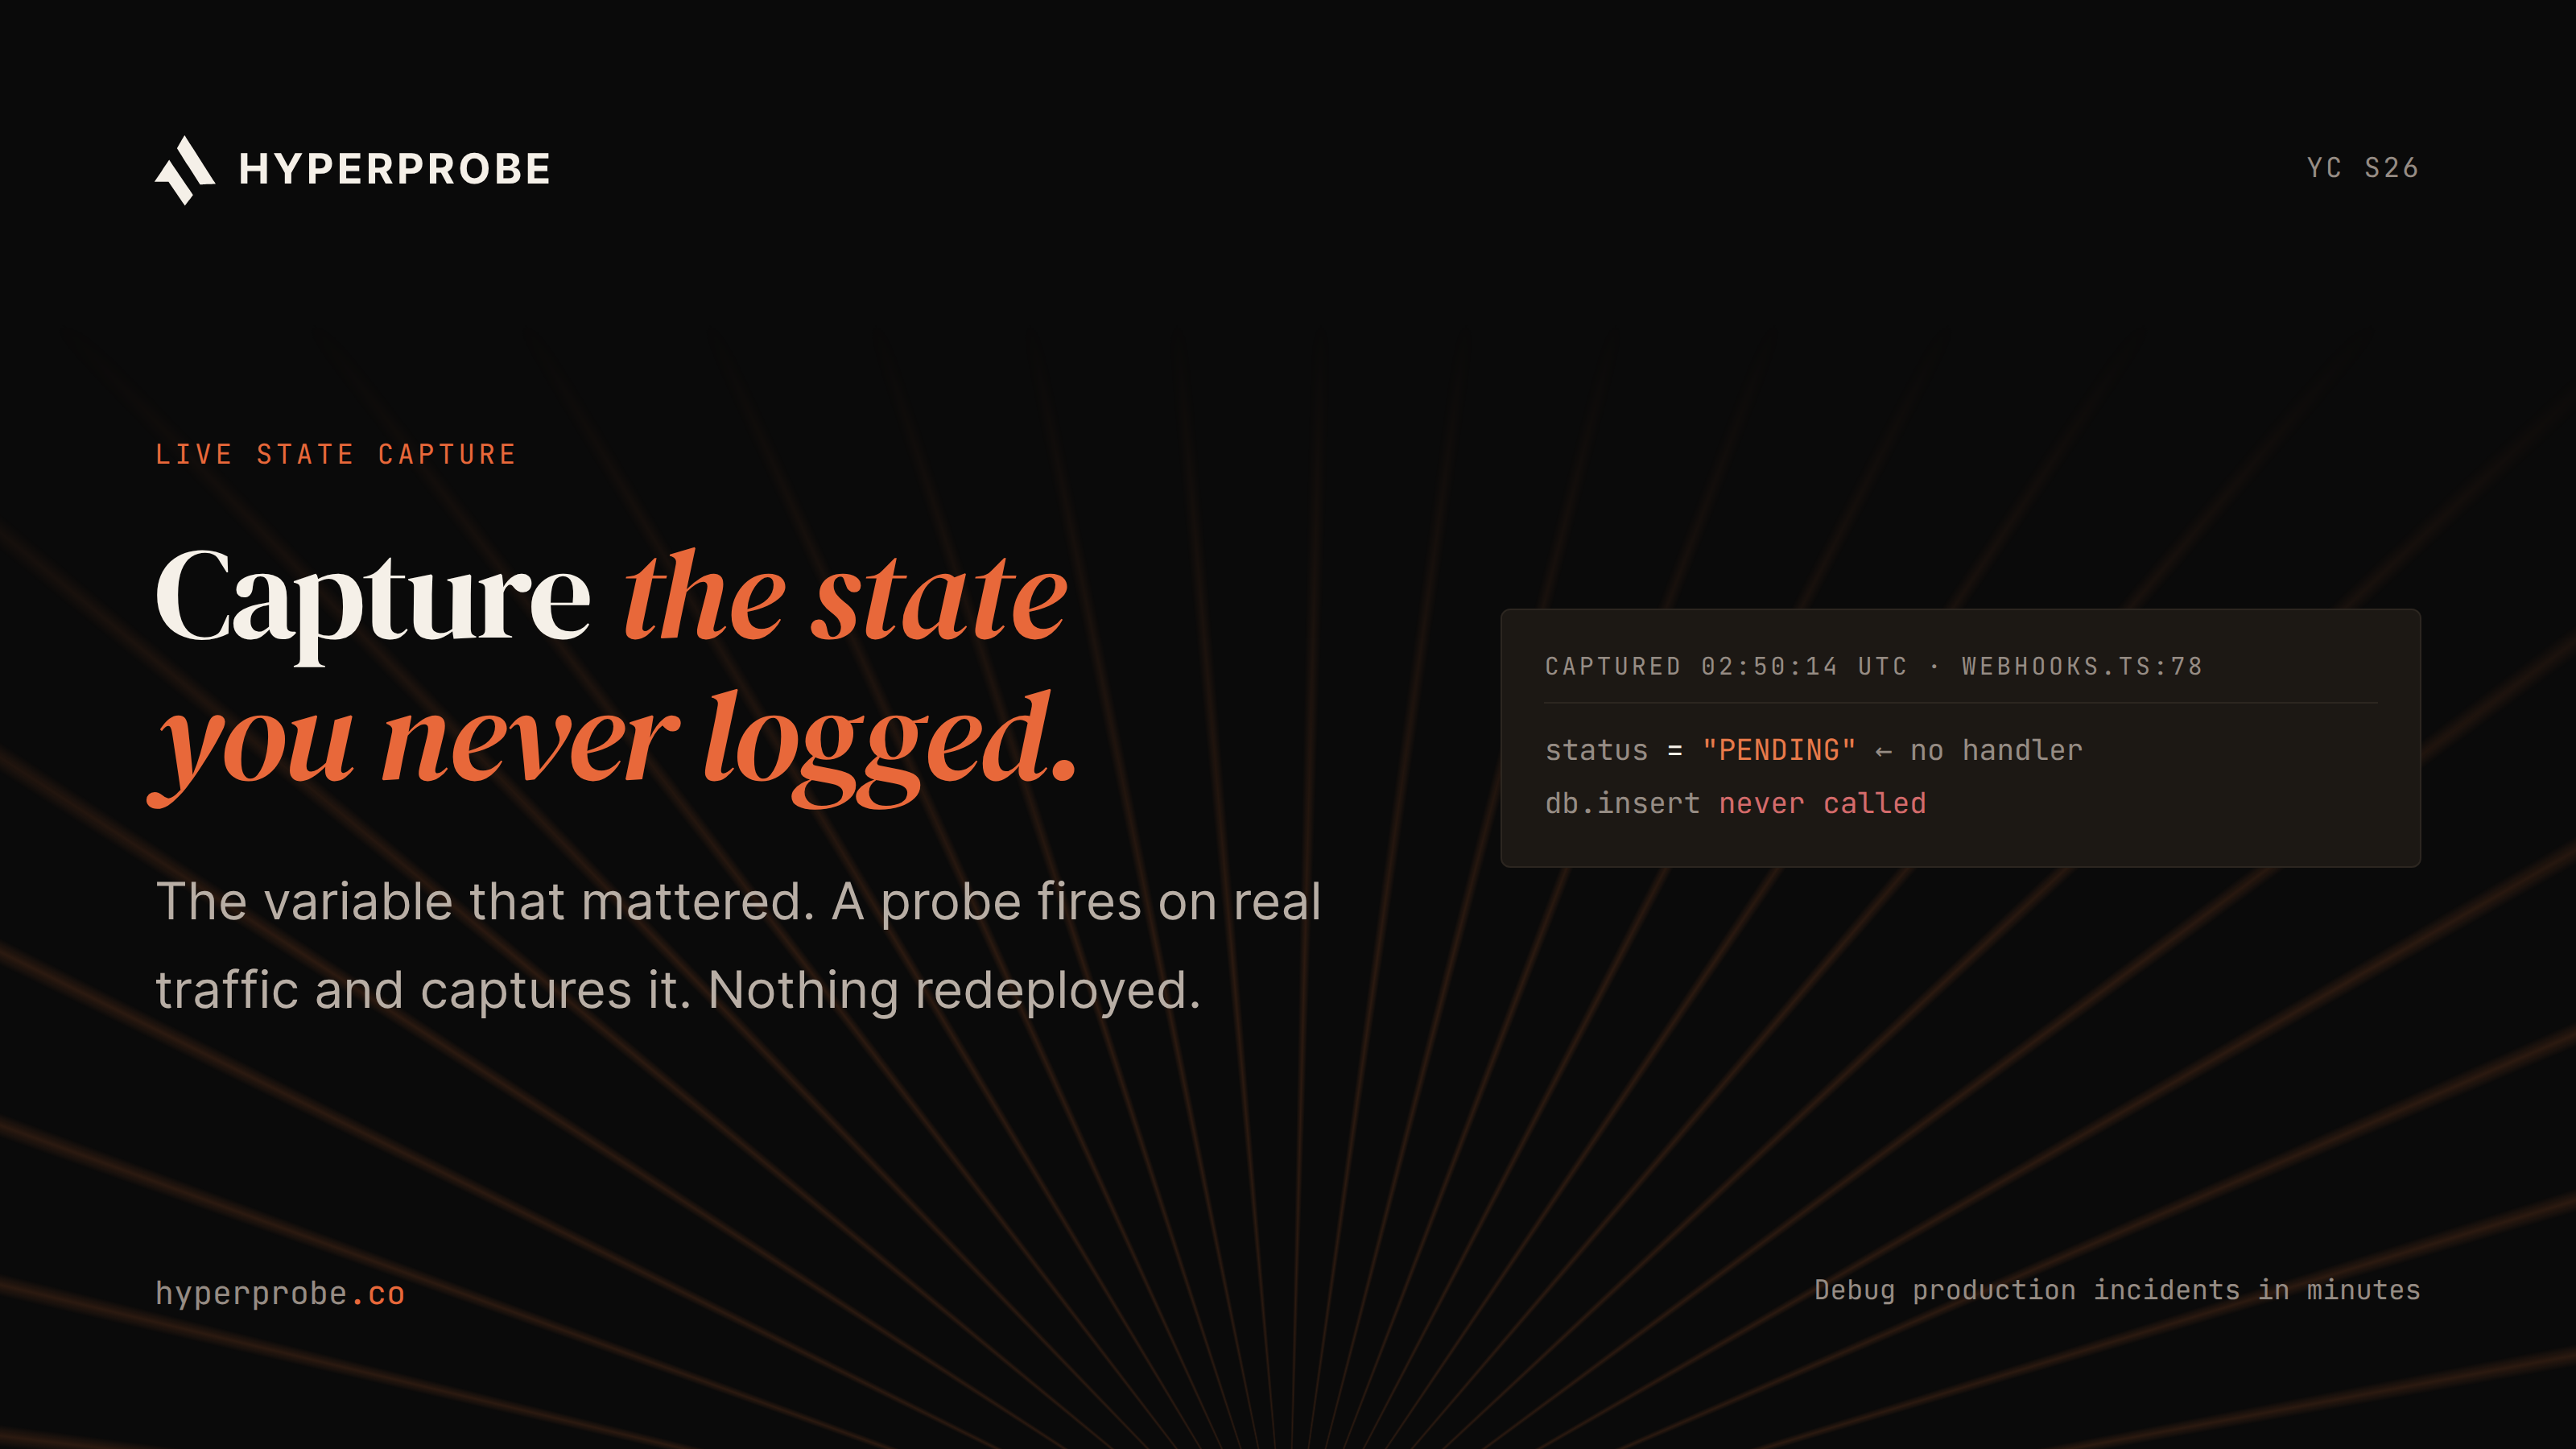
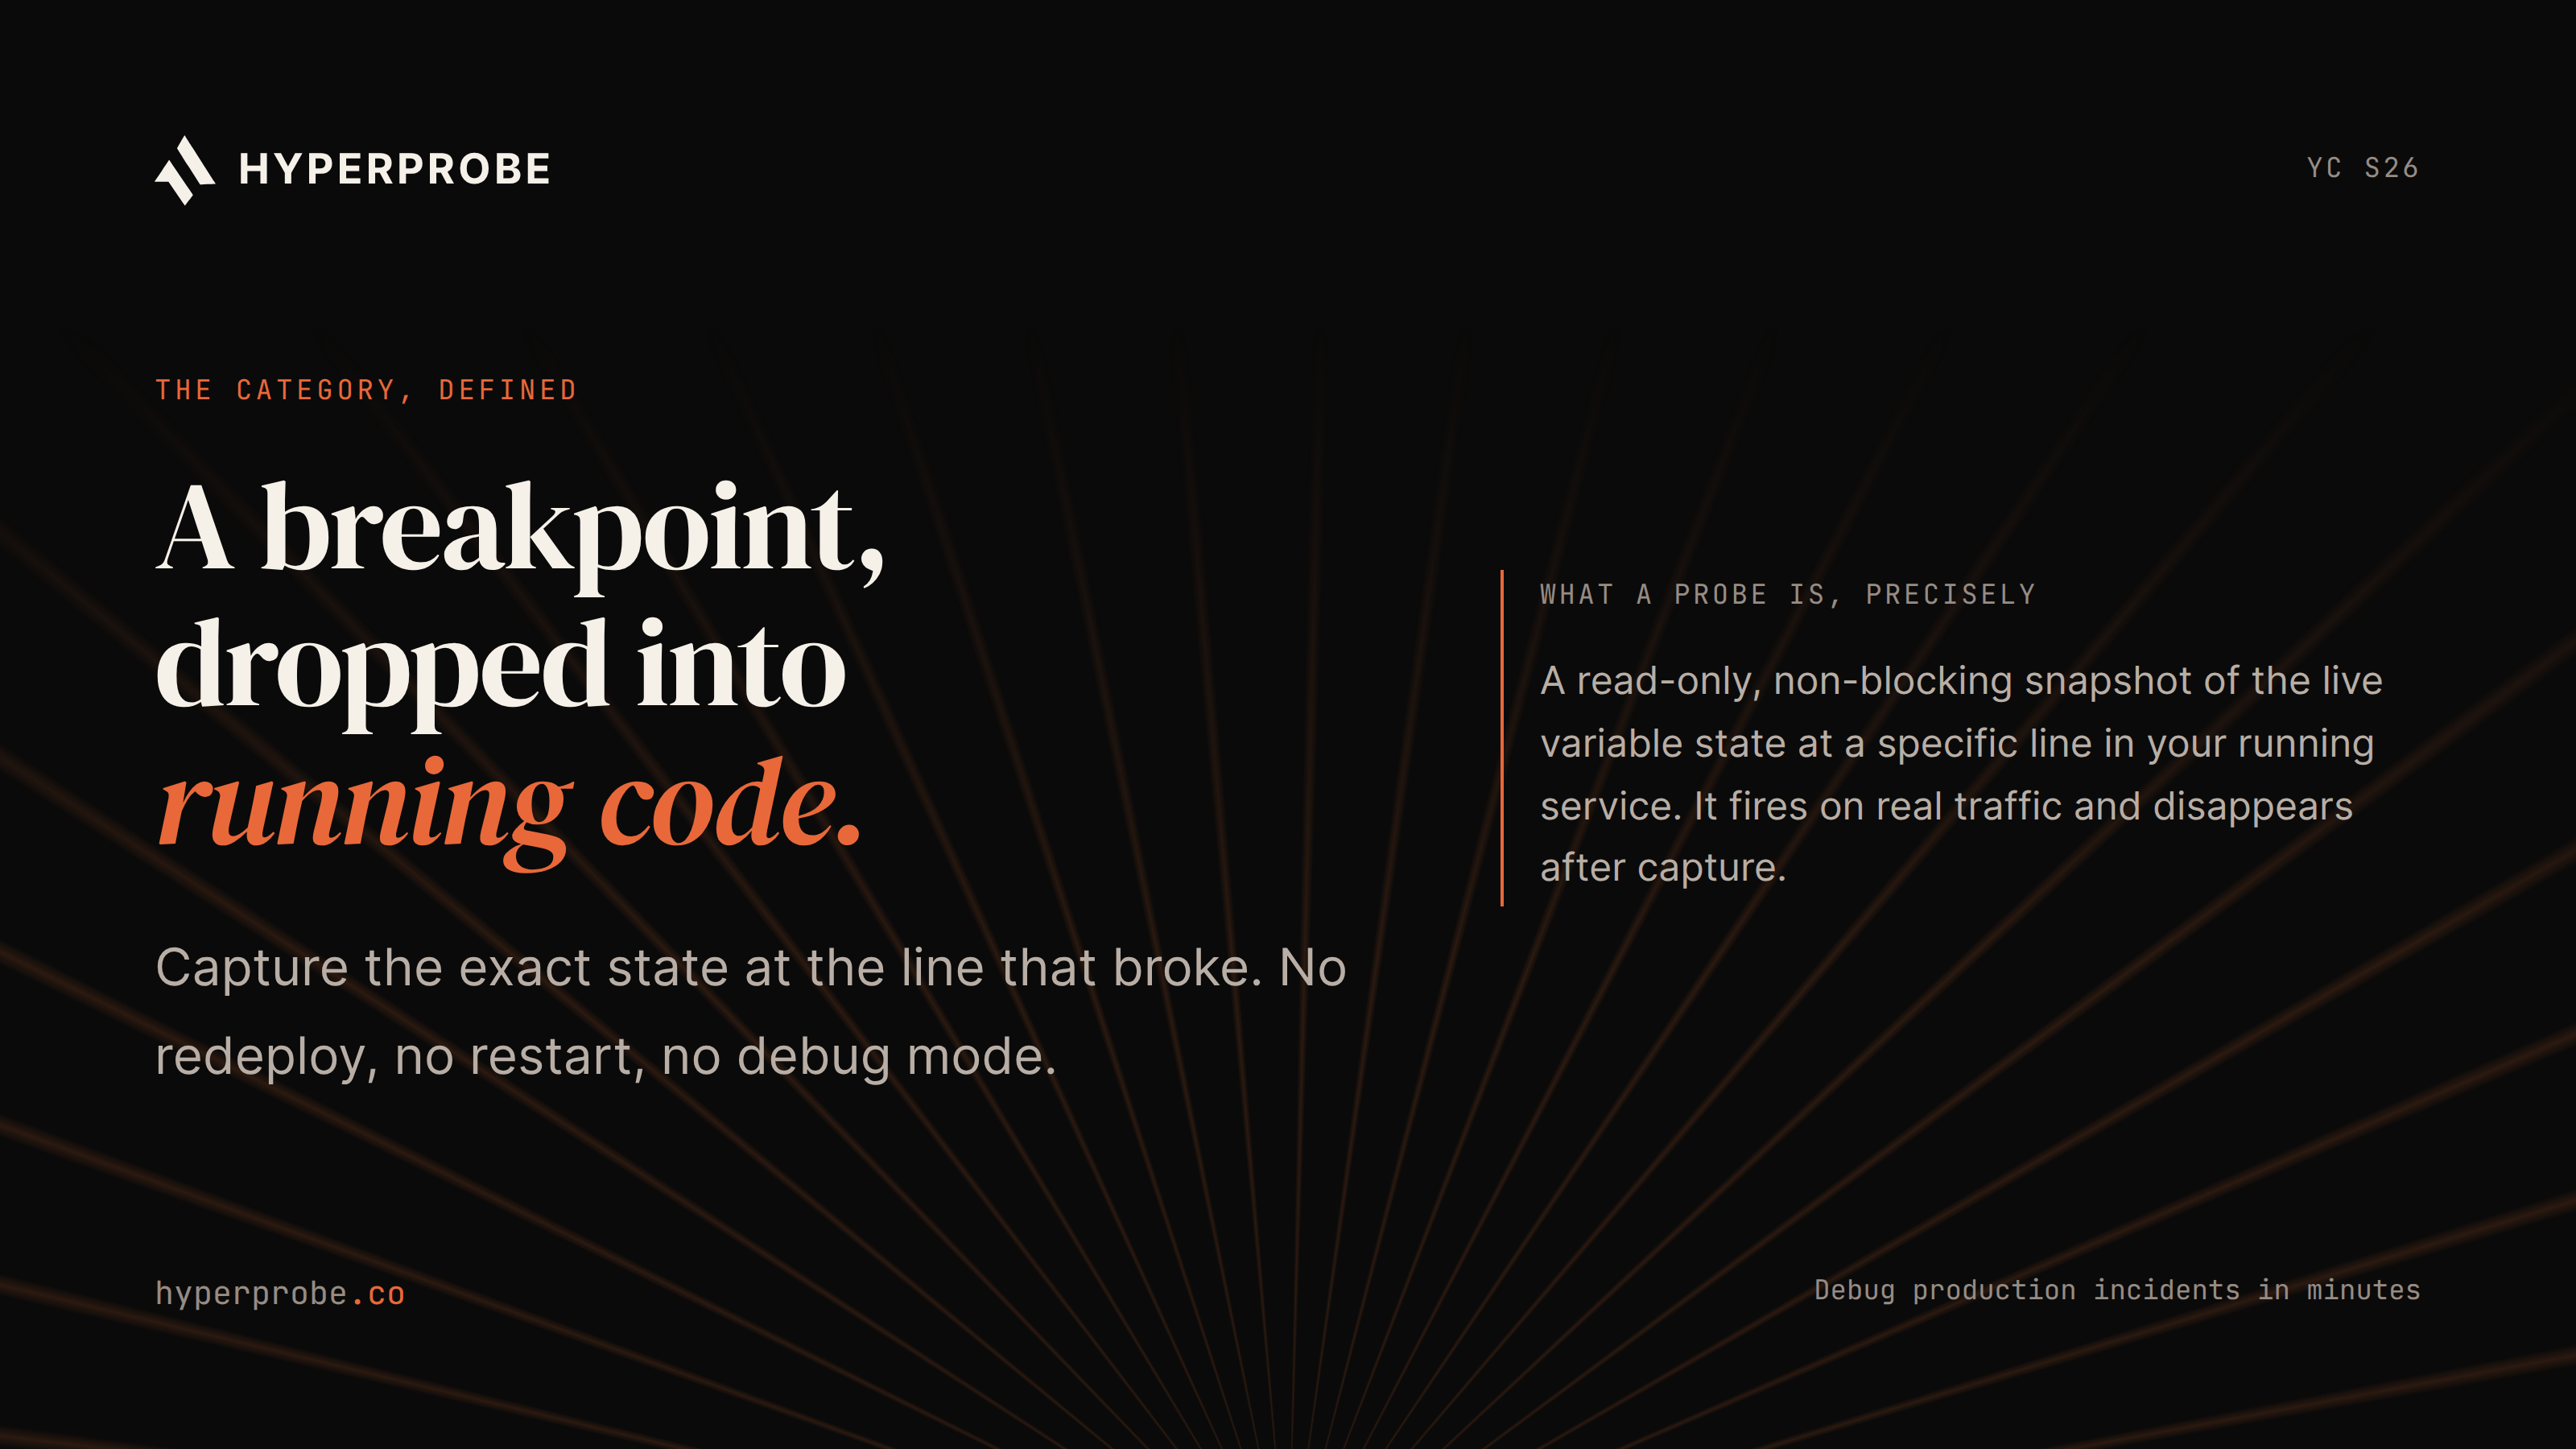
HyperProbe adds an evidence-capture layer to an existing observability stack. Its read-only probes and proprietary SDK capture variable state and diagnostic context at the relevant code path, so engineers can investigate the request that failed instead of trying to recreate a request that probably will not fail again.
The production variable inspection workflow explains why this context matters when logs are incomplete.
Pros
- Captures runtime evidence for failures that are difficult or impossible to reproduce.
- Complements Datadog, New Relic, Honeycomb, and other observability platforms instead of requiring a full migration.
- HyperProbe describes its agent as redacting PII by default and its platform as providing immutable audit logs.
- Private VPC or self-hosted deployment options may suit security-sensitive environments, subject to vendor confirmation for the required plan.
- Its stated unlimited probe and capture model can make broad instrumentation easier to evaluate.
Cons
- Teams still need observability for dashboards and long-term telemetry.
- Relevant services need SDK instrumentation before runtime evidence can be captured.

2. Datadog
Datadog brings infrastructure metrics, logs, traces, deployment events, and application monitoring into one platform. It is a practical choice when an intermittent 500 may involve several layers and the team already wants a broad observability system.
Pros
- Provides wide integrations across infrastructure, applications, logs, and traces.
- Connects errors to relevant services, deployments, or infrastructure components.
- Offers cross-signal search and anomaly detection in a unified observability platform.
Cons
- May lack the variable state that explains why one request failed.
- Can leave engineers correlating dashboards without decisive runtime evidence.
3. Sentry, best for application exceptions
Sentry groups errors, shows stack traces and breadcrumbs, connects failures to releases, and helps route issues to owners. It fits product teams whose intermittent 500s usually come from application exceptions and who need fast issue triage.
Pros
- Groups errors and connects them to releases, owners, and application context.
- Provides developer-friendly workflows, breadcrumbs, and session replay.
- Seer can use issue details, traces, logs, profiles, and code context to form an initial hypothesis.
Cons
- Is strongest at the application layer.
- May not explain connection pool exhaustion, host pressure, or a downstream timeout outside the captured exception context.
4. New Relic
New Relic traces transactions across services and combines application performance data with infrastructure and dependency monitoring. It is a strong fit for teams that want detailed request paths and performance analysis in an established APM workflow.
Pros
- Reveals slow or failing spans, dependency behavior, and service patterns around the 500 response.
- Supports attribute correlation between anomalous traces and a healthy baseline.
- Fits teams that want detailed request paths in an established APM workflow.
Cons
- Consumption-based pricing requires careful volume modeling.
- May show where a request failed without revealing the runtime variable that explains it.
5. Honeycomb, best for high-cardinality investigation
Honeycomb is built for exploring event data with many dimensions, which helps teams ask questions such as whether failures occur only for one tenant, region, release, route, or feature flag. That makes it useful for distributed systems with complex traffic patterns.
Pros
- High-cardinality queries expose patterns that aggregate dashboards can hide.
- Helps teams connect failures to attributes such as tenant, region, release, route, or feature flag.
- Supports investigation of complex distributed systems and traffic patterns.
Cons
- Requires separate incident coordination.
- Depends on relevant attributes being captured before the incident.
6. Lightrun
Lightrun captures runtime information at a specific code path without requiring a traditional redeploy for every diagnostic change. Its AI SRE positioning focuses on evidence from live application execution and verifiable investigation.
Pros
- Lets engineers inspect a targeted code path when logs and traces are too broad.
- Reduces the need to reproduce a production-only condition locally.
- Integrates with incident workflows and observability platforms.
Cons
- Still needs to sit alongside broader observability and incident management.
- Requires controls around who can add diagnostics and what data those diagnostics expose.
7. PagerDuty, best for incident coordination
PagerDuty is the right choice when the central problem is alert ownership, escalation, and on-call response. It helps teams acknowledge incidents, coordinate responders, and manage operational schedules.
Pros
- Provides mature routing and escalation workflows.
- Helps alerts reach the right responder and remain visible during the incident.
- Supports on-call schedules and coordinated incident response.
Cons
- Does not perform the technical investigation itself.
- Should be paired with Datadog, Sentry, Honeycomb, HyperProbe, or another system that can explain the root cause.
How to choose a root cause analysis tool
Start with the evidence gap, not the vendor category.
- Choose unified observability when your team cannot connect infrastructure, application, and deployment signals.
- Choose error monitoring when stack traces, releases, and ownership are the main bottleneck.
- Choose tracing when the key question is which service or span diverged.
Add runtime evidence capture when the request fails too rarely to reproduce and the existing tools do not show the state that triggered it. Add incident response when the team struggles to route and coordinate alerts.
Security and operating model matter too. Review read-only behavior, agent-side redaction, audit logging, data retention, and whether the vendor offers private VPC or self-hosted deployment.
Price the high-volume case, not only the average month. A tool that looks inexpensive at normal traffic can become expensive when an incident produces a sudden telemetry spike.
For teams that already have an observability stack in place, adding an investigation layer can be less disruptive than replacing existing tools. HyperProbe follows this approach by working alongside APM and monitoring systems, helping teams investigate production issues more deeply without requiring a full migration.
A practical workflow for intermittent 500 errors
When an intermittent 500 occurs, use the following sequence to move from symptom to evidence-backed cause.
- Capture the request or correlation ID and reconstruct the request across every service it touched.
- Compare the failed trace with a healthy request on the same route, release, tenant, or feature flag cohort.
- Check deployments, configuration changes, dependency latency, resource pressure, and flag rollouts within the failure window.
- Check status-code classification, timeout budgets, retries, circuit breakers, and resource limits. Capture variable state and stack context at the failing code path when logs and traces show where the request diverged but not why.
- Rank hypotheses against linked evidence. Do not treat an AI-generated explanation as a confirmed root cause until an engineer can verify it.
- Ship the smallest safe fix, then confirm the error rate and related signals improve in production.
This workflow reduces repeated manual reconstruction from partial logs, which protects engineering capacity during on-call work.
Final recommendation
There is no single root cause analysis tool for every intermittent 500. Datadog and New Relic fit broad APM needs, Sentry fits application exceptions, Honeycomb fits high-cardinality event investigation, Lightrun fits live code-path diagnostics, and PagerDuty fits alert coordination.
HyperProbe may fit teams whose missing evidence is runtime state from a request that will not reproduce. It is designed to capture that evidence alongside an existing observability stack, subject to the team's security and deployment review. Book a 30-minute walkthrough to evaluate it against an intermittent failure in your stack.
Frequently asked questions
What is the best tool for diagnosing intermittent 500 errors?
The best choice depends on the missing evidence. Distributed tracing shows where a request failed, observability platforms correlate logs and infrastructure signals, and runtime evidence tools can capture variable state when the failure cannot be reproduced.
Why are intermittent 500 errors difficult to troubleshoot?
They often depend on transient conditions such as dependency timeouts, resource exhaustion, traffic patterns, configuration, or a specific request cohort. By the time an engineer investigates, the relevant runtime state may be gone.
Do logs and traces identify the root cause of every 500 error?
No. Logs and traces can show the failing service, request path, and timing, but they may not contain the variable values or resource state that triggered the failure.
Should I replace my existing observability platform with an RCA tool?
Usually not. An RCA tool should fill the evidence or investigation gap in the existing stack. Confirm that it integrates with current logs, traces, metrics, deployment systems, and incident workflows.
What security controls should an RCA tool provide?
Review data minimization, redaction, access controls, audit logs, retention, encryption, deployment options, and whether captured production values can contain secrets or personal information.
Written by
Founder
Shailendra Singh is the founder and CEO of HyperProbe (YC S26), an AI on-call agent that debugs production incidents by capturing evidence directly from running services. He has over a decade of experience building and running production systems, starting at Applied Materials before moving into startup operating and engineering leadership roles, including at a company that later became a unicorn. He founded and ran Transporter.city from 2017 to 2021, then spent three years building HyperTest before founding HyperProbe with Karan Raina. He writes about production debugging and incident response.
RELATED READS