Quick Overview:
Mean time to resolution (MTTR) is often driven more by investigation than alerting. This blog breaks down where incident response time goes, from missing telemetry and repeated debugging experiments to delayed approvals and recovery verification. It also explains how teams can audit incident timelines and use dynamic instrumentation to diagnose production issues without repeated code changes or redeployments.
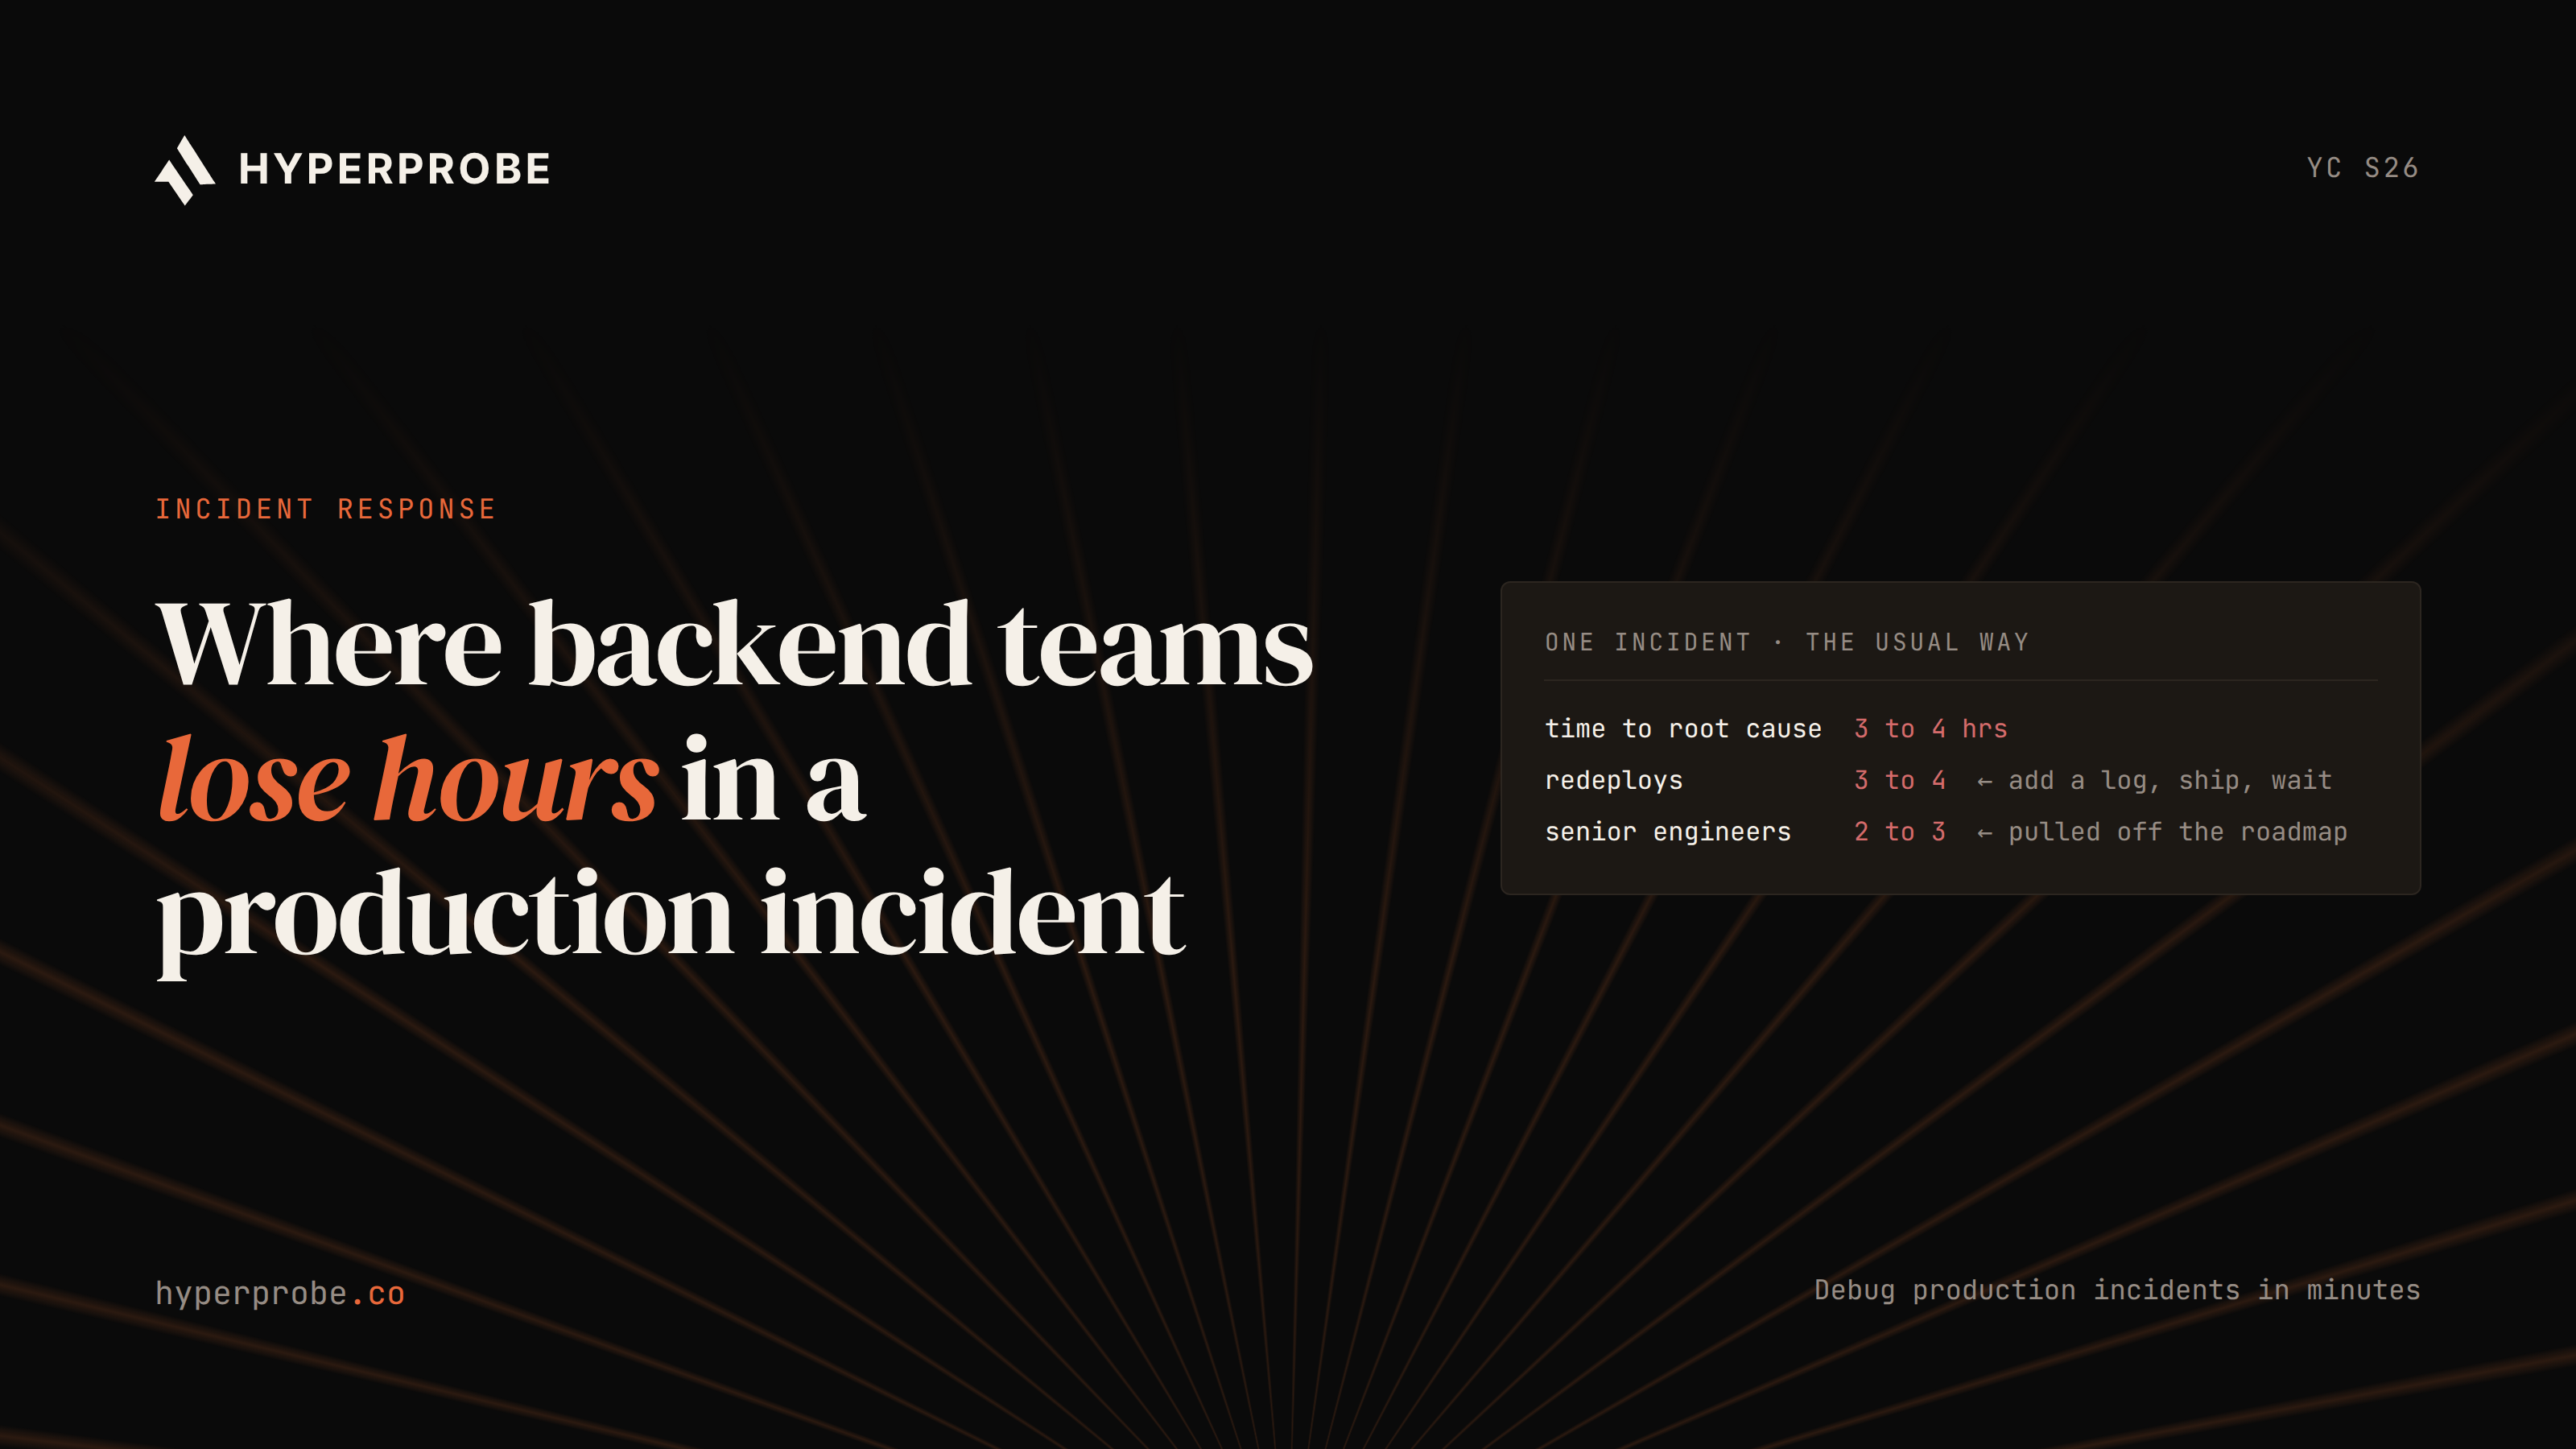
The page fires at 02:14 and someone acknowledges it by 02:25. Then the incident runs for another three hours. Engineering managers see that pattern in their dashboards every quarter, and the usual response is to tighten alerting, which attacks the eleven minutes that were already fine. The hours live somewhere else.
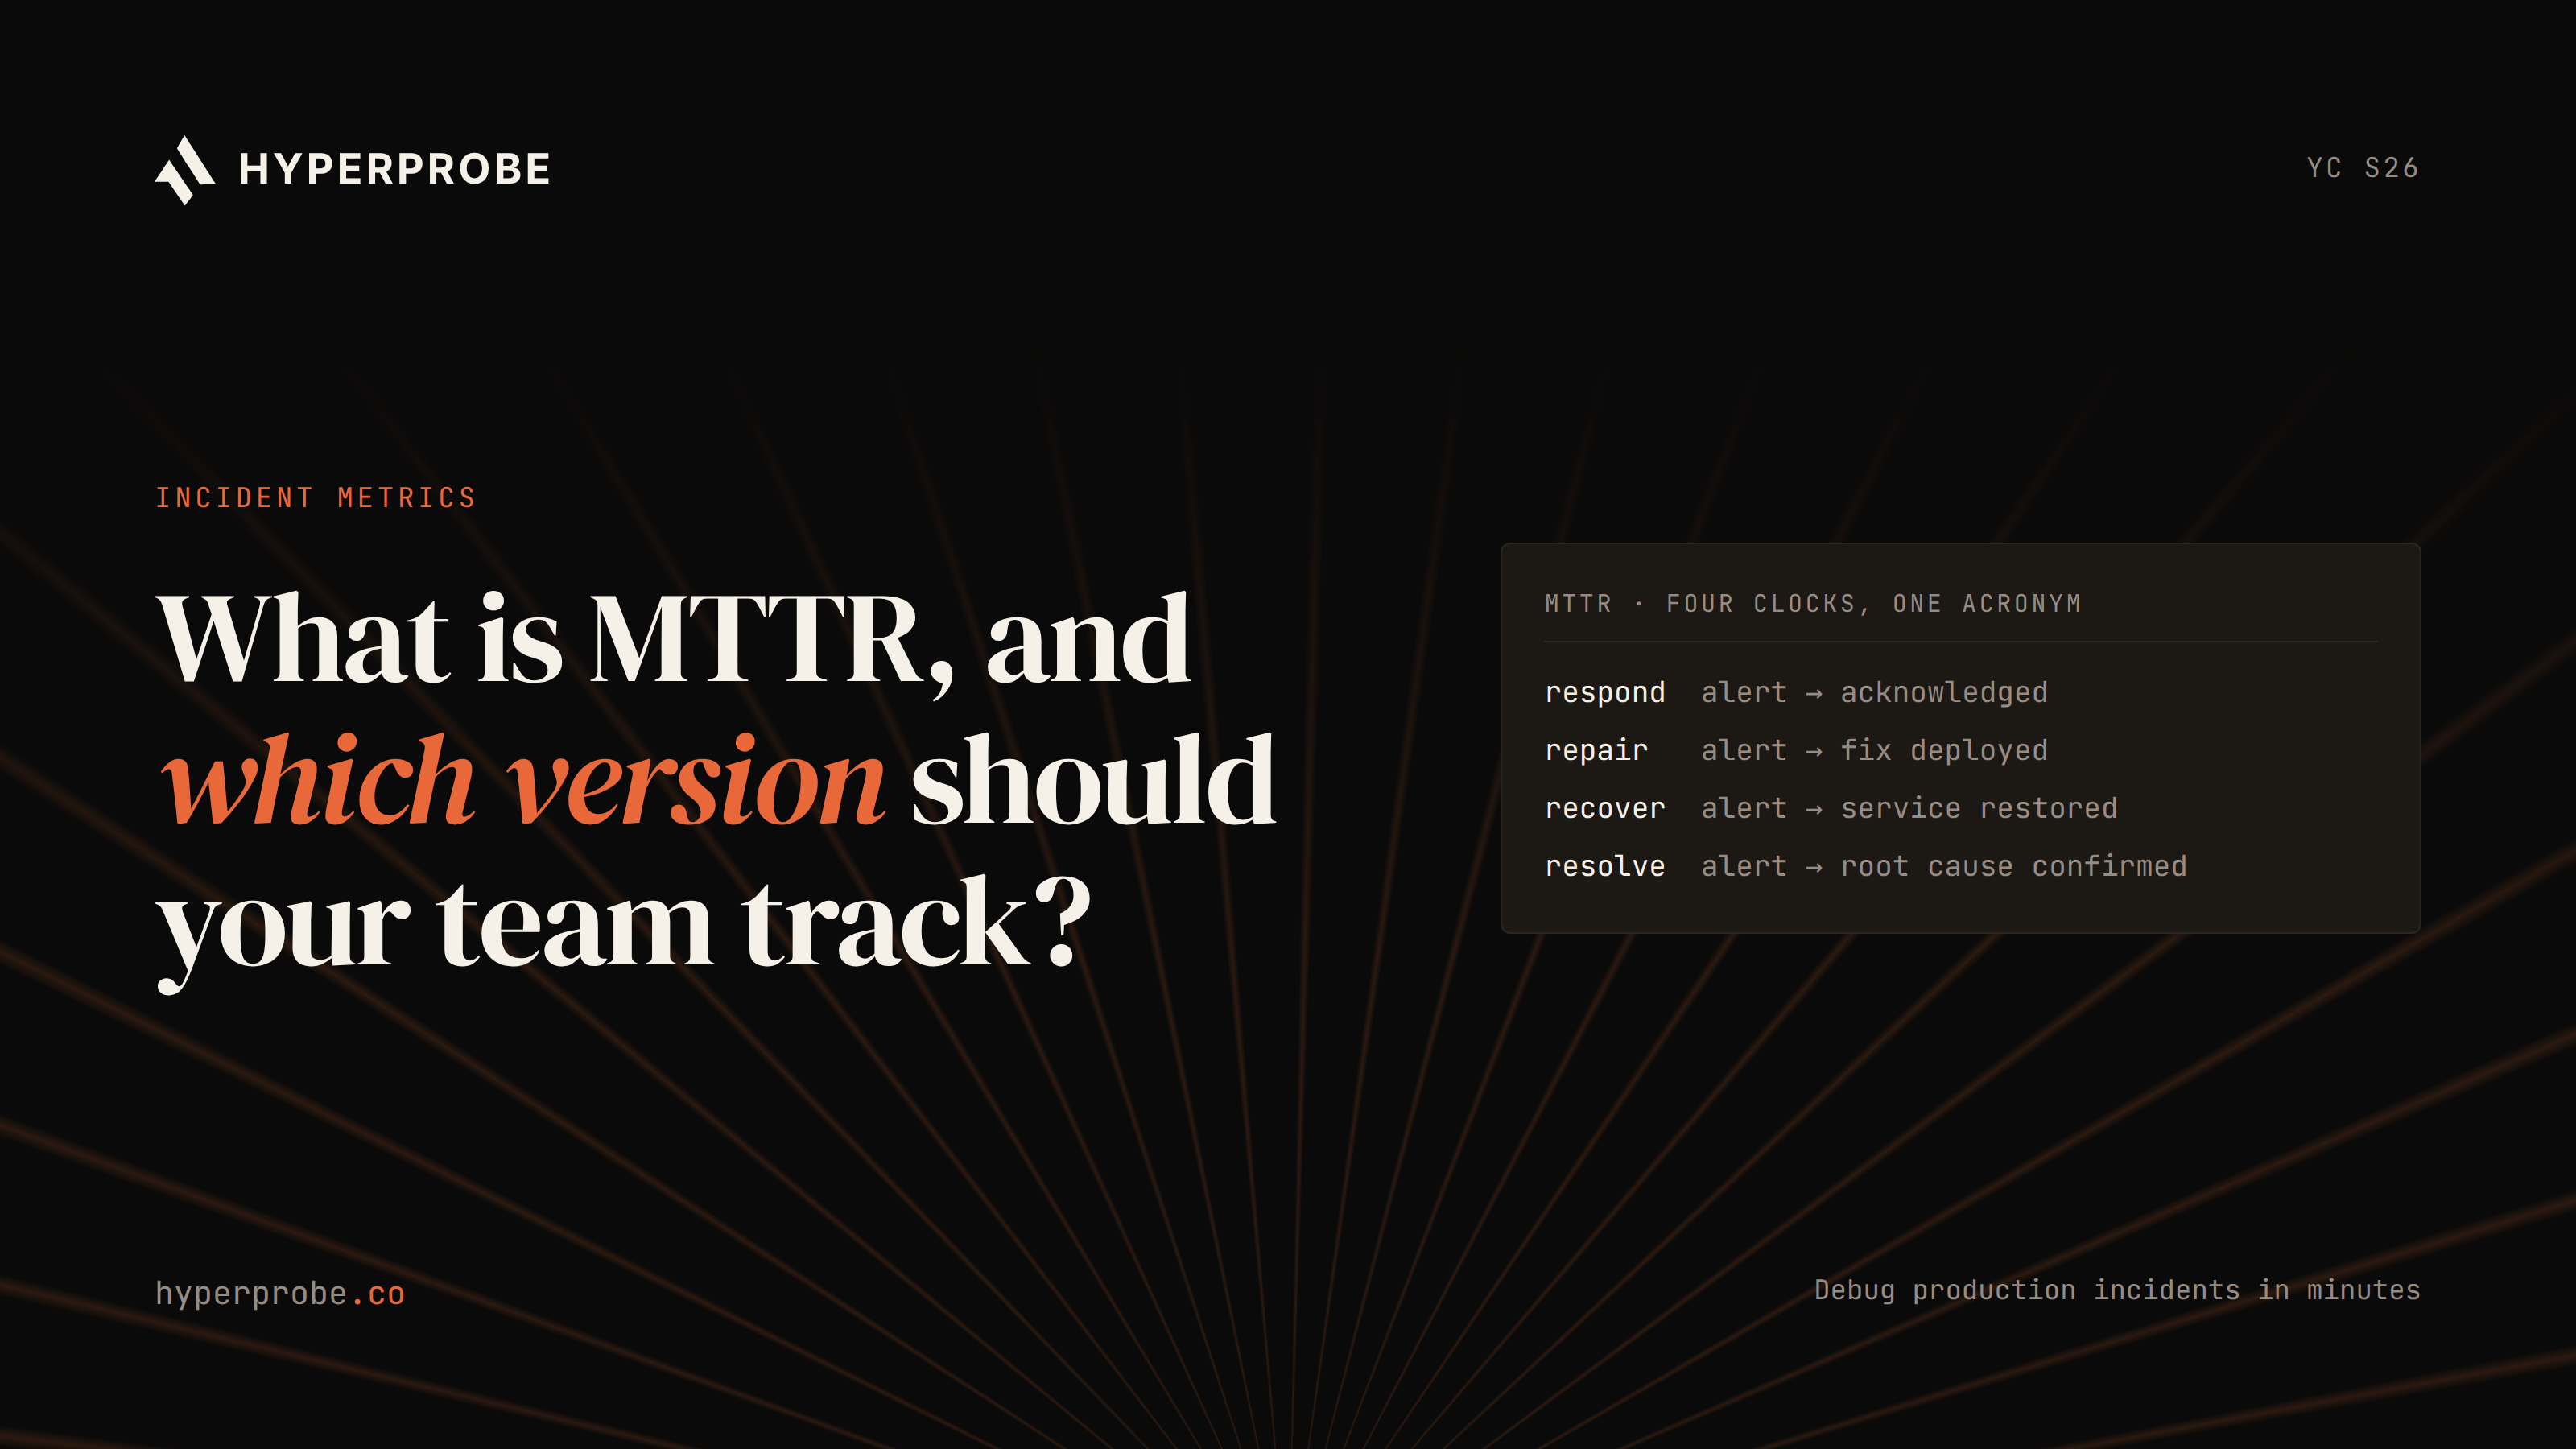
Mean time to resolution is the average time from the start of an incident to the point where the service is confirmed healthy and the incident is closed. The different versions of MTTR matter when you compare teams, but for this guide the question is simpler.
Inside a single backend incident, which phases eat the time, and by how much? Published incident studies give a usable answer, and the proportions are lopsided enough to change where a team should invest. The stakes are large: engineers report spending about 33% of their time on firefighting and disruptions, according to the 2025 Observability Forecast, which surveyed 1,700 practitioners across 23 countries.
Where mean time to resolution actually goes
In published studies of production incidents, detection accounts for roughly a tenth of mean time to resolution, debugging for well over half, and recovery for the remainder. A Purdue study of live debugging in production cloud systems, presented at SoCC 2024, normalized the timelines of sampled Google Cloud incidents and found detection at 10.8%, debugging at 62.5%, and recovery at 29.2% of total duration, with an average resolution time of 3.88 hours.
The same study found that 89.3% of those failures were debugged entirely in production, because the conditions could not be reproduced anywhere else.
Mapping those phases onto the standard incident lifecycle shows where each sink sits.
| Phase |
What happens |
Where time leaks |
| Detect |
Monitor fires or a customer reports |
Noisy pages, missed monitors |
| Triage and hand off |
Responder finds the owner and the change |
Context reconstruction, ownership lookup |
| Investigate |
Collect evidence, form and test hypotheses |
Missing telemetry, redeploys, experiments |
| Fix and roll out |
Rollback, config change, or code fix |
Approvals, permissions, slow rollouts |
| Verify and close |
Confirm recovery, write the postmortem |
Waiting for recurrence, postmortem from memory |
Teams optimize detection because it is the easiest phase to measure and the alert rules are theirs to change. Investigation is where the budget actually goes, and it is the phase with the fewest tools pointed at it.
Alerts that burn time before anyone starts
The first sink opens before anyone has looked at a dashboard, because noisy paging wears down the person who will eventually have to investigate. An on-call survey presented at SRECon Americas 2025 found that 43% of engineers had been woken by alerts that resolved themselves or required no action, and that each interruption cost at least 15 minutes of attention regardless of whether the alert was real. Those minutes do not show up in mean time to resolution for the incident that woke them, but they accumulate as fatigue, and a tired responder at 02:14 investigates more slowly than a rested one.
The second cost arrives from the opposite direction. In a Microsoft Research study of 152 high-severity incidents in Microsoft Teams, about 55% were caught by automated monitors while 29% were reported by external customers. A customer-reported incident has already been running for as long as it took someone to notice, complain, and get routed to the right team. The study traced those misses to static thresholds, buggy monitors, and telemetry that was never collected for the failing scenario.
A practical fix is to treat every page as a 15-minute debit against the team and audit alerts quarterly on that basis. An alert that has never led to action in three months is costing time with no return.
Finding the owner and rebuilding context
Once a real alert reaches a real person, the next block of time goes to answering questions that have nothing to do with the bug. Which service is this? What changed in the last day? Who owns the dependency that is throwing errors? The SRECon survey flagged incomplete handoffs as a direct hit to responder confidence and recommended a 15 to 30 minute overlap between shifts purely for context sharing, which is a measure of how much context a fresh responder has to rebuild when no overlap exists.
The problem is broader than shift changes. Atlassian's 2025 survey of 500 US incident management practitioners found that lack of full visibility across infrastructure was the top pain point at 35%, up from 22% the year before, even as 78% said pulling the right stakeholders into an incident had become easy. Teams have solved the paging problem and are now stuck on the knowing problem.
Two cheap interventions help. Pipe deploys, config changes, and feature flag flips for every service into the incident channel automatically, so the responder sees what changed without asking. Keep a current ownership map so the question of who to page next takes seconds. Both remove minutes from triage, and both make the next phase, where the real hours hide, start sooner.
Collecting information nobody recorded
This is the largest sink by a wide margin. The Purdue study broke debugging into its component steps and found that information collection made up 51% of them, diagnosis 25%, and verification 24%. Half of debugging effort goes to gathering the data needed before any reasoning about the failure can start.
The Microsoft study explains why. Among incidents with complex root causes, 27% were delayed because the required telemetry was never logged, and 55% because figuring out the bug in a code change simply took time. Code bugs were also the single largest root-cause category at 27%, and they had the longest detection and mitigation times of any category.
Why the log line lacks the value
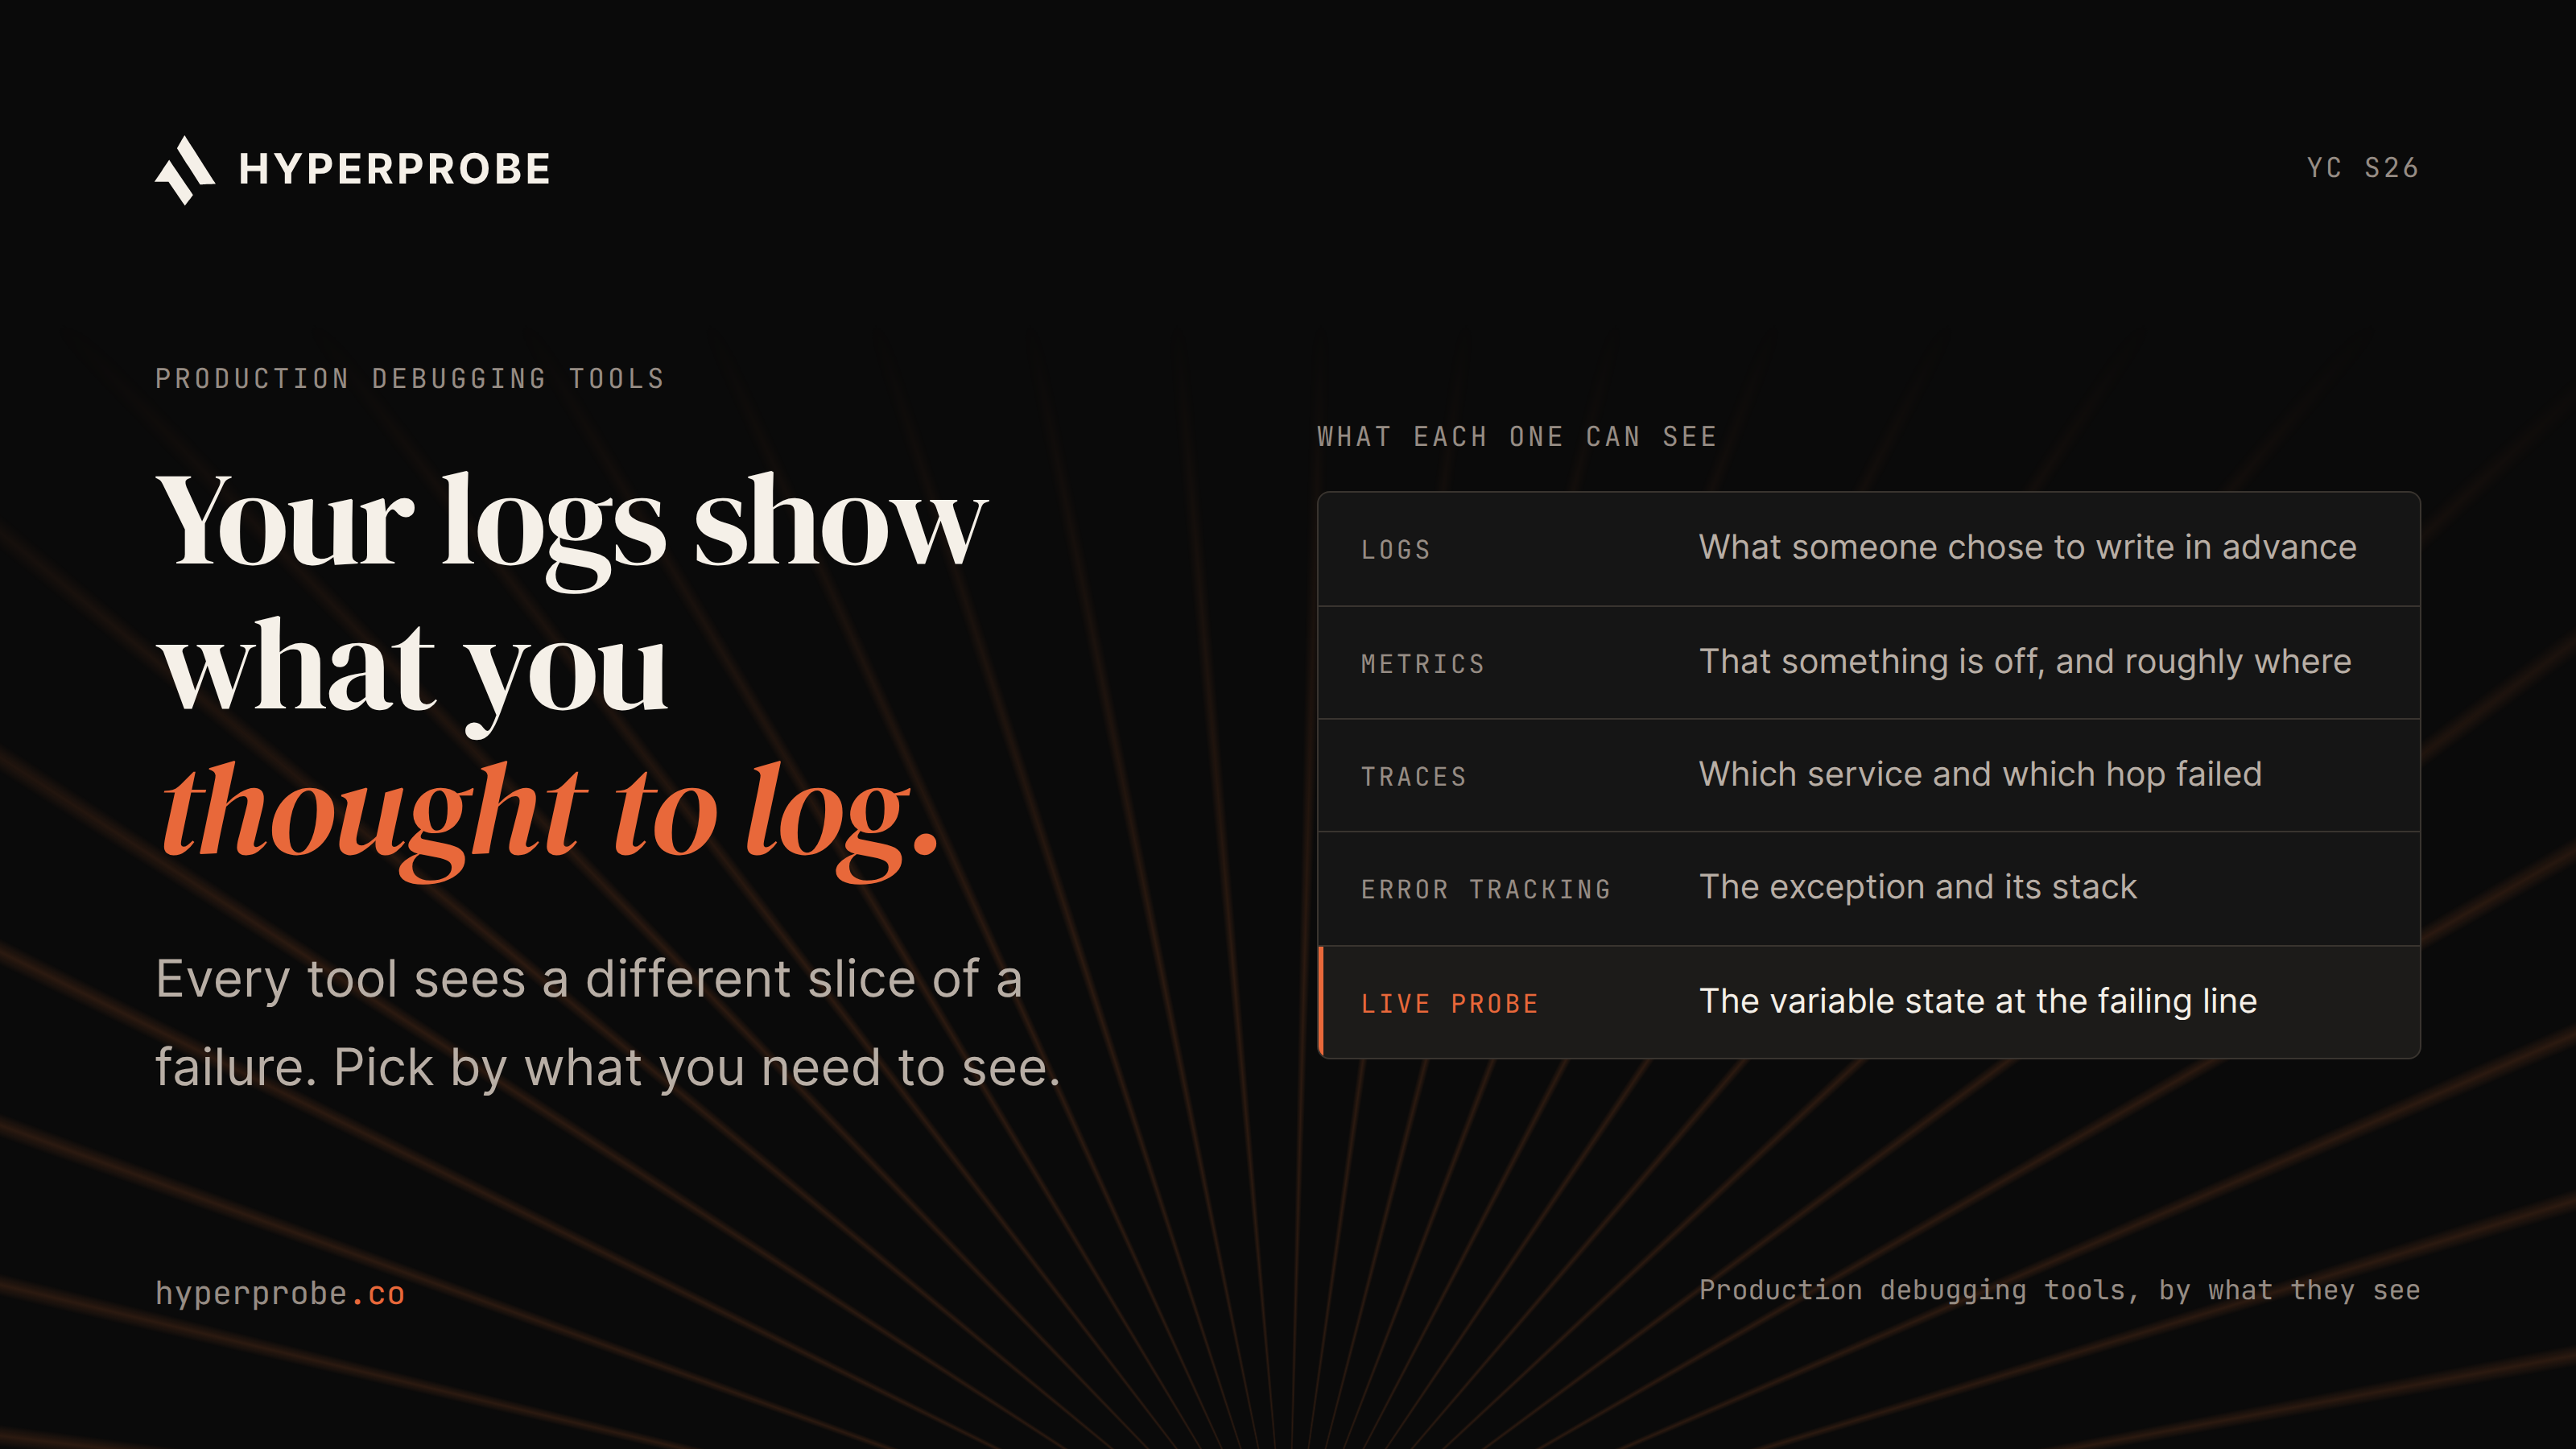
Logs are written before the failure exists, by someone guessing what might go wrong. They record that a request failed and often which code path it took, but rarely the local variable that explains the branch. A typical error log looks like this:
logger.error("checkout failed", extra={"order_id": order.id, "status": resp.status})
The value that explains the failure, say the discount rule that produced a negative total, was never serialized because nobody expected it to matter. The responder can see which orders fail and when, and cannot see why.
Reading live state without a redeploy
The default escape is to add a log line, open a pull request, deploy, and wait for the failure to recur. Each loop costs a build, a review, a rollout, and however long recurrence takes, and the first guess is often the wrong variable. The redeploy loop and its costs are covered in detail elsewhere on this blog, so the short version here is that it converts a diagnosis problem into a deployment problem, and deployments are slow.
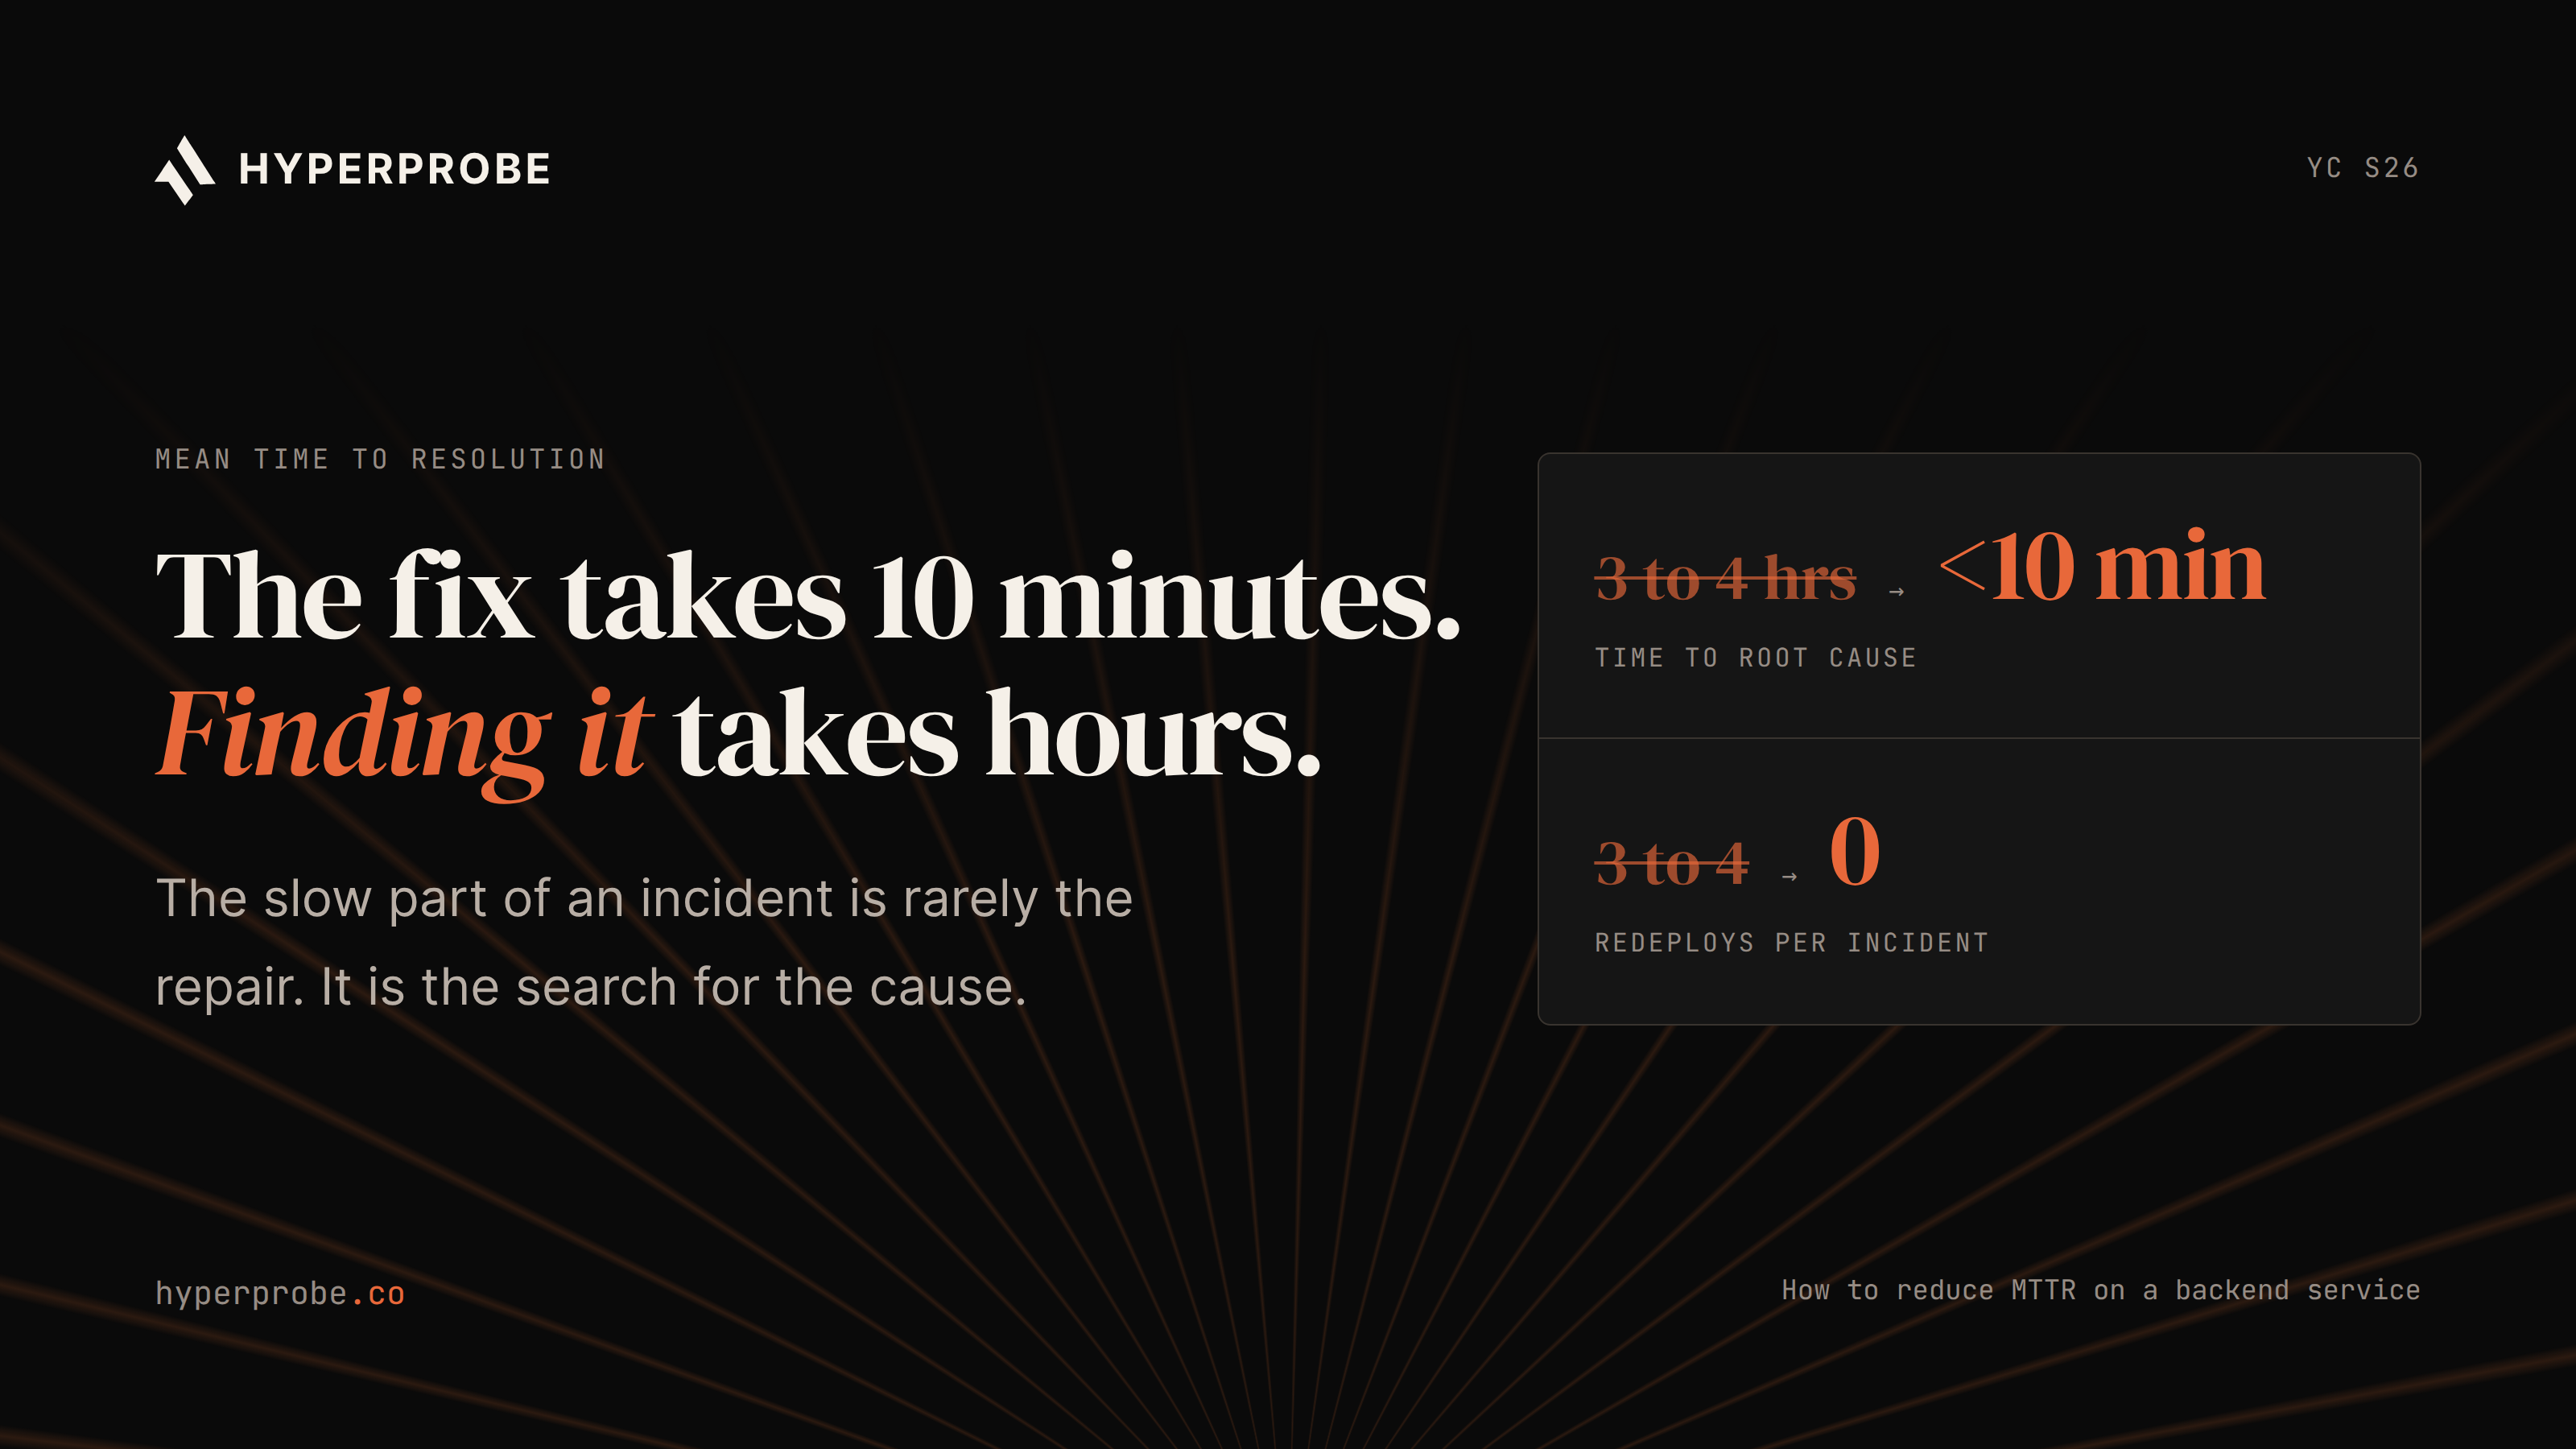
Dynamic instrumentation removes the loop by attaching a probe to a running process and capturing variables at a chosen line on the next execution, with no code change and no restart. The responder asks for the value instead of guessing which value to log, and gets it the next time the failing path runs.
Hypothesis churn and live experiments
When evidence is thin, engineers experiment. The Purdue study found that in-production interventions made up 49% of debugging actions, roughly even with passive observation. Those interventions were config changes (41%), restarts (30%), direct commands (14%), upgrades (9%), and code changes (6%). Each one is a hypothesis test run against live traffic, and each one costs the time to apply it, the time to wait for an effect, and the risk of making things worse.
Churn compounds when the hypothesis is wrong. In the Microsoft dataset, among incidents delayed by manual effort, 29% were slowed by an initial misdiagnosis that led the team to execute the wrong mitigation first, and another 14% by multiple on-call engineers running steps simultaneously without coordination.
Two habits cut this sink. Write the hypothesis in the incident channel before intervening, with the signal that would confirm or refute it, so a restart that changes nothing is recognized as a refuted hypothesis rather than repeated. And prefer capturing evidence over changing state wherever a probe can answer the question, because a captured variable settles an argument that a restart only postpones.
Waiting after the cause is known
Knowing the root cause does not end the incident. The Microsoft study found that 30% of incidents had mitigation delays after the root cause was identified, due to external approvals, on-call engineers lacking permission to deploy or disable a feature, changes that took a long time to propagate, and troubleshooting guides that did not say when to declare an outage or which team to engage.
The same dataset shows why rollback dominates. Although 40% of incidents were caused by code or configuration bugs, nearly 80% were mitigated without a code or config fix, through rollback (22.4%), infrastructure changes (21.1%), or external fixes. Manual code fixes took significantly longer to mitigate than reverts.
The managerial lever here is pre-approval. Decide in daylight which mitigations the on-call engineer may execute without a sign-off, give that engineer the deploy and flag permissions to do it, and write the guide down to the level of the exact command. Roll back first when a rollback exists, and capture the evidence before reverting so the root cause investigation does not have to wait for the bug to come back.
Verification and the postmortem debt
Verification took 24% of debugging steps in the Purdue data, and for intermittent failures it has a cruel shape. Confirming that a fix worked means waiting for the conditions that triggered the bug to occur again and observing that nothing breaks. Hours can pass with the incident technically open and an engineer watching a graph.
The debt then rolls into the postmortem. Catchpoint's SRE Report 2025 found that 14% of respondents reported higher stress after incidents as well as during them, a signal that post-incident work is landing badly. Postmortems written from memory a week later lose the details that would have shortened the next incident, so the next incident starts from zero and the cycle repeats. Capturing evidence during the incident, rather than reconstructing it afterward, is the fix for both the verification wait and the postmortem gap, since the same captured state that confirmed the cause also documents it.
How to audit your own incident hours
Averages hide the lopsided shape above, so measure the stages directly. Record five timestamps for every incident: impact start, alert acknowledged, cause confirmed, mitigation applied, and service restored. Four stage durations fall out of those, and the one between acknowledged and cause confirmed is the diagnosis span that mean time to resolution usually buries.
Add three counts per incident. How many deploys shipped only to gather evidence, how many engineers were pulled in beyond the on-call, and how many in-production experiments ran before the cause was known. Review medians and p90 by severity over a quarter. Given the proportions in the studies above, expect the diagnosis span to be the largest stage and the evidence-only deploy count to explain most of it. That count, rather than the alerting threshold, is the lever worth pulling.
Where HyperProbe fits
HyperProbe sits alongside the logging, tracing, and APM tools a team already runs and targets the diagnosis span specifically. Its SDK places read-only probes in a running service and captures the variables at a chosen line on the next execution, with PII redaction applied at the agent before any value leaves the service and a time to live on every probe so it clears itself.
An AI on-call agent runs the investigation, forms hypotheses, places the probes, and confirms the root cause against the captured evidence. The engineer reviews that evidence and commits the fix. The distinction between this approach and conventional monitoring is covered in AI SRE vs APM, and teams that debug from an editor can connect the same capability through MCP servers for production debugging. The first real incident worked through with HyperProbe is free.
Start with the biggest block
The eleven minutes between page and acknowledgement were never the problem. The hours sit in investigation, where evidence was never recorded and experiments run against live traffic, and in approvals that arrive after the cause is already known. Start the five-timestamp audit on the next incident and give responders a way to read production state without shipping code. Install the HyperProbe SDK from the installation docs and run the next incident with evidence instead of guesses.