Alert management software for engineering teams in 2026

Quick Overview
- Eight tools fit engineering teams in 2026: PagerDuty, incident.io, Rootly, Grafana IRM, Better Stack, Datadog On-Call, Zenduty and BigPanda.
- The tools differ most in how they group alerts, how reliably they reach a phone at 3 a.m., and which unit the bill counts.
- Stable deduplication keys, grouping windows and payload-based routing cut alert fatigue more than any single feature.
- Alert management ends when someone acknowledges the page, so diagnosis of why a service failed needs a separate tool such as HyperProbe.
- Test each shortlisted tool on 30 days of your own real alerts before you buy.
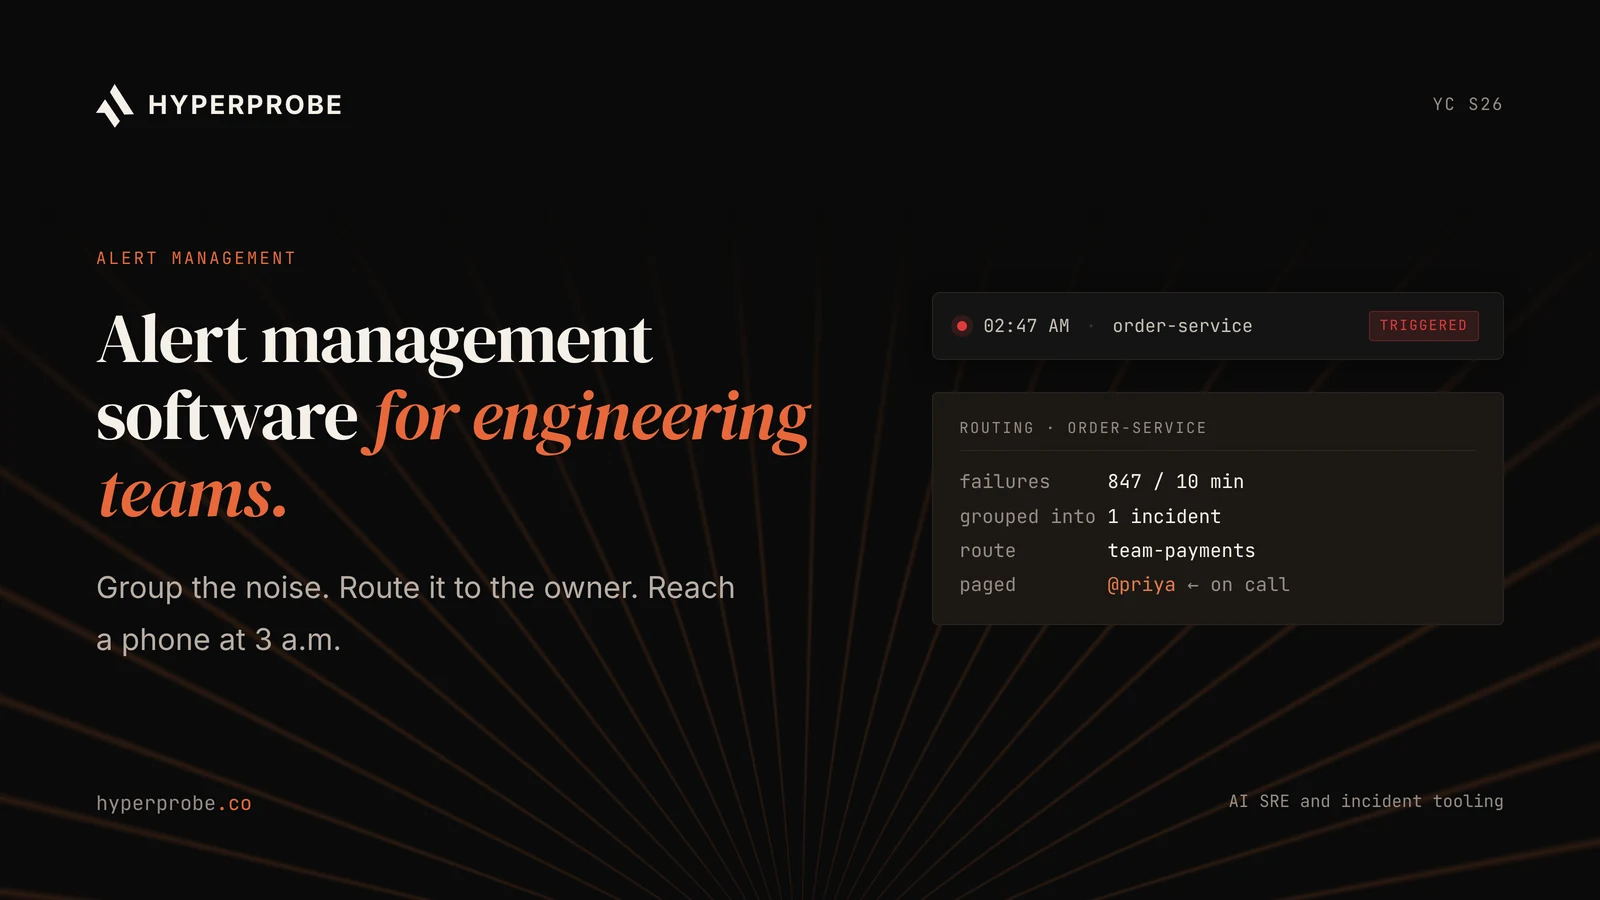
The best alert management software for engineering teams in 2026 includes PagerDuty, incident.io, Rootly, Grafana IRM, Better Stack, Datadog On-Call, Zenduty and BigPanda, with HyperProbe beside them for the diagnosis that starts after the page. Alert management software takes alerts from monitoring tools, removes duplicates, groups related alerts, routes each group to the owning team and escalates until a person acknowledges it. The tools differ most in how they group alerts, how reliably they reach a phone at 3 a.m., and which unit the bill counts.
The problem these tools solve is concrete. One bad deploy can fire hundreds of alerts across a dozen services within minutes. Without grouping and routing, six engineers get paged for the same root event, and the one alert that names the failing dependency is buried on page three.
Which alert management tools fit engineering teams?
Eight alert management tools fit engineering teams in 2026, from full paging platforms to a dedicated correlation layer, and HyperProbe covers the work after the page. The table below lists each tool with its alerting strength, list entry price and the team it suits.
| Tool | Alerting strength | Entry paid price (list) | Best for |
|---|---|---|---|
| HyperProbe | Works after the page: captures live code-level evidence | Per service, unlimited probes and captures | Teams whose pages end in a long hunt for the cause |
| PagerDuty | Event orchestration, 700+ integrations | $21 per user per month annual | Large organizations with complex routing |
| incident.io | Alert routing and grouping inside chat-native response | $15 per user per month annual, plus $10 on-call | Teams that run incidents in Slack or Teams |
| Rootly | On-call with shadow rotations and coverage gap checks | $20 per user per month for On-Call | Teams that want on-call and response as separate products |
| Grafana IRM | Alert groups from Grafana alerting rules | $20 per active user plus $19 platform fee | Teams on Grafana Cloud |
| Better Stack | Uptime monitoring and paging in one license | $29 per responder per month annual | Lean teams that want monitoring included |
| Datadog On-Call | Pages directly from Datadog monitors | $20 per seat per month | Teams whose alerts already fire in Datadog |
| Zenduty | Low entry price with AI on the Growth tier | $5 per user per month annual | Small and cost-sensitive teams |
| BigPanda | Cross-tool event correlation for high alert volume | Not public | Large NOCs with many monitoring tools |
Prices are list prices from vendor pricing pages and public comparisons in November 2026. Opsgenie is absent from the table because Atlassian stopped selling it on June 4, 2025.
What does alert management software do?
Alert management software runs every alert through a fixed pipeline between the monitoring tool and the person who responds. The list below names each stage and what it does.
- Ingest. The tool receives events from monitors, uptime checks, error trackers and custom webhooks.
- Deduplicate. Repeated events with the same deduplication key collapse into one alert, so a flapping check does not page twenty times.
- Group. Related alerts join one incident, by rule, by time window or by a model that learns which alerts tend to fire together.
- Route. The incident goes to the owning team based on service, tag or payload content.
- Escalate. The tool notifies the on-call person and moves to the next person or tier when nobody acknowledges within a set time.
- Notify. Notifications go out by push, SMS, voice call, email and chat.
- Acknowledge and resolve. The responder acknowledges, which stops escalation, and resolves when the issue clears.
Every paging tool on this list covers stages 1, 2, 4, 5, 6 and 7. Grouping is where they separate. Rule-based grouping is predictable and needs maintenance. Model-based grouping adapts to new services but can merge unrelated failures. Model-based grouping pays off at high alert volume. At low volume, rules are easier to audit.
How were these alert tools evaluated?
These alert tools were evaluated on six criteria that decide whether the right person gets one useful page. The list below states each one.
- Integrations. Native connectors for the monitoring tools in use, plus a generic webhook and email ingest.
- Grouping and deduplication. Configurable keys, time windows and suppression during maintenance.
- Routing and escalation. Rules on service, tag and payload, multi-tier escalation and schedule overrides.
- Notification reliability. Phone and SMS coverage by country, caps on notifications and a status history of the vendor's own delivery.
- Audit trail and deployment model. A log of every routing decision and acknowledgement, and the hosting regions on offer.
- Pricing clarity. Published seat prices and clear rules on who counts as a billable user.
Each tool below follows the same structure: best for, what it does, strengths, limits and public pricing. HyperProbe comes first because it starts where every alerting tool stops: after the page is acknowledged.
Which tool works the incident after the page?
HyperProbe works the incident after the page, which is where every alert management tool below stops. An alert names a service and a symptom. The engineer who acknowledges it still has to find the cause in running code.
1. HyperProbe
Best for: Engineering teams whose pages land on the right person but still end in hours of adding log lines and redeploying to find the cause.
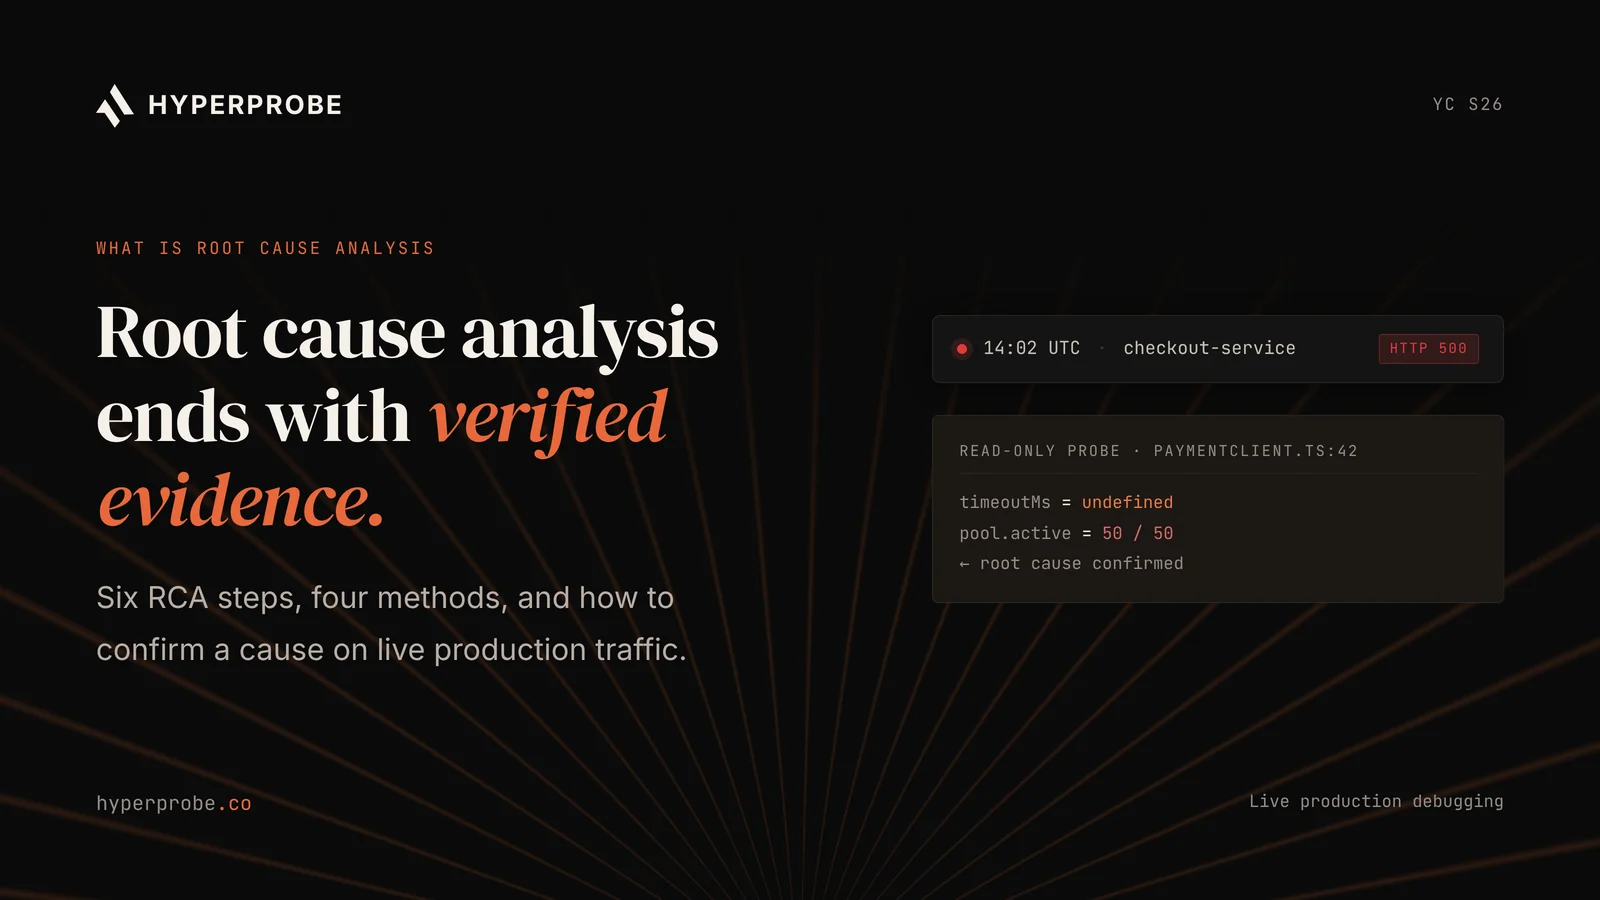
What it does: HyperProbe is an AI on-call agent for live production debugging, built on dynamic instrumentation. Dynamic instrumentation means adding a capture point to running code without changing the source or redeploying. After the page, HyperProbe places a read-only probe on the suspect line and captures variable state the next time that line runs, so the responder confirms the root cause from evidence. The guide to inspecting a live production variable without adding a log line shows the workflow.
Strengths: Read-only probes do not pause production, change source code or require a redeploy. PII is redacted at the agent before capture, and probes self-clear on a time limit and rate limit. Commit SHA alignment is enforced before a probe attaches. Private VPC and self-hosted deployments are available for enterprise teams.
Limits: HyperProbe does not ingest, group, route or page alerts. It needs one of the eight alerting tools below to reach the responder, and it complements that tool rather than replacing it.
Public pricing: Pricing is per service, with unlimited probes and captures on every tier, so cost does not grow with alert volume or seat count.
Try it: Install the SDK and place your first probe with the HyperProbe quickstart, or book a walkthrough to run it on one of your own past incidents.
Which alert management tools lead?
The eight alert management tools below lead on routing, grouping and price transparency. The order runs from full paging platforms to the dedicated correlation layer.
2. PagerDuty
Best for: Organizations with many teams, many monitoring tools and routing rules that depend on payload content.
What it does: PagerDuty ingests events through hundreds of integrations and its Events API, applies Event Orchestration rules to route and enrich them, and pages responders through schedules and escalation policies.
Strengths: The catalog of more than 700 integrations lowers setup work for unusual monitoring sources. Event Orchestration can route on any field in the payload, suppress known noise and add context before the page goes out. The mobile app and notification delivery have a long production record.
Limits: Noise reduction based on machine learning sits in the AIOps add-on, which is licensed separately from seats. Status pages are also an add-on below Enterprise. The full cost for a mid-size team is often well above the seat price.
Public pricing: PagerDuty is free for up to 5 users. Professional is $21 per user per month on annual billing ($25 monthly). Business is $41 per user per month on annual billing ($49 monthly). AIOps and Enterprise are sales-led.
3. incident.io
Best for: Engineering teams that run incidents in Slack or Microsoft Teams and want alerting in the same product.
What it does: incident.io On-call ingests alerts, routes and groups them, and pages responders. The alert becomes an incident in the same tool, with a channel, roles and a timeline.
Strengths: Alerting and response share one data model, so the incident starts with the alert context attached. Alert routing and grouping are included on the Team plan. The on-call add-on is charged only for people on a rotation, not for every user.
Limits: Teams that want a standalone pager without the incident response product pay for features they may not use, though a standalone On-call plan exists. Advanced insights sit on the Pro tier.
Public pricing: incident.io offers a free Basic plan with single-team on-call. Team is $15 per user per month on annual billing, plus $10 per on-call user. Pro is $25 per user per month, plus $20 per on-call user. A standalone On-call plan is $20 per user per month.
4. Rootly
Best for: Teams that want on-call as its own product, with scheduling features that large rotations need.
What it does: Rootly On-Call ingests alerts, routes them through escalation policies and pages responders, and can run without Rootly's incident response product.
Strengths: Shadow rotations let new engineers receive pages alongside the primary responder before they take a shift alone. Coverage gap detection flags shifts with nobody assigned. Live call routing gives callers a phone number that connects to whoever is on call.
Limits: On-Call and Incident Response are separate licenses, so an engineer who needs both costs two seats. Rootly's AI SRE is a third product, priced by quote, and now requires Incident Response.
Public pricing: Rootly lists On-Call at $20 per user per month and Incident Response at $20 per user per month. Enterprise is sales-led.
5. Grafana IRM
Best for: Teams that write alert rules in Grafana and want routing and on-call in the same place.
What it does: Grafana IRM turns Grafana alerting rules and external alerts into alert groups, routes them through escalation chains and pages through schedules. It combines what used to be Grafana OnCall and Grafana Incident.
Strengths: An alert group links straight back to the dashboard and query that fired it. Escalation chains can branch on labels from the alert rule. The free tier covers 3 active users.
Limits: The open source Grafana OnCall repository was archived on March 24, 2026, so self-hosted paging is no longer available outside Grafana Enterprise. Grafana's billing documentation states that a user listed in a schedule or escalation chain is billable for the month, even with no pages.
Public pricing: Free for up to 3 active IRM users. Pro is $20 per active IRM user per month, plus the $19 monthly Grafana Cloud platform fee.
6. Better Stack
Best for: Small and mid-size teams that want uptime monitoring, status pages and paging under one license.
What it does: Better Stack runs uptime checks and heartbeats, pages responders through on-call schedules and publishes status pages. It also offers logs, metrics, traces and an AI SRE feature as separate meters.
Strengths: One responder license includes on-call scheduling with unlimited phone call and SMS alerts. Team members who only read telemetry are free. A team without an existing uptime monitor gets one included.
Limits: The responder license is the floor of the bill. Extra monitor packs, status page features and telemetry volume are priced on top. Complex multi-team enterprise routing needs validation in a trial.
Public pricing: Better Stack is free for personal projects with 10 monitors. A responder license is $29 per month on annual billing ($34 monthly). The AI SRE feature is billed on consumption.
7. Datadog On-Call
Best for: Teams whose alerts already fire from Datadog monitors.
What it does: Datadog On-Call pages responders directly from Datadog monitors, with schedules, escalation policies and a mobile app. On-Call reached general availability in January 2025.
Strengths: The responder lands on the graph, logs and traces behind the alert without leaving Datadog. There is no integration hop between the monitor and the pager, which removes one failure point in the alert path.
Limits: Alerts from tools outside Datadog need an integration, which removes the main advantage. Incident Management and AI investigation are separate products with their own seats or credits. Shadow rotations are not offered, according to a Better Stack comparison.
Public pricing: Datadog lists On-Call at $20 per seat per month. The Incident Response bundle with Incident Management is $40 per seat per month.
8. Zenduty
Best for: Small teams and cost-sensitive teams that need routing, escalation and on-call at a low seat price.
What it does: Zenduty ingests alerts from monitoring tools, applies routing and suppression rules, and pages responders through schedules and escalation policies.
Strengths: The Starter seat price is the lowest on this list. The Growth tier includes AI SRE investigation, AI incident summaries, AI postmortems and an MCP server, which gives coding agents access to incident data.
Limits: Starter caps free calls and texts at 100 per user per month in the US, Canada and India, and at 25 per user elsewhere, with overages billed. Starter also limits teams to 5 users, 1 team and 5 integrations. Status pages are a paid add-on on Growth.
Public pricing: Zenduty has a free plan. Starter is $5 per user per month on annual billing ($6 monthly). Growth is $14 per user per month annual ($16 monthly). Enterprise is $21 per user per month annual ($25 monthly).
9. BigPanda
Best for: Large IT operations and network operations centers that receive alerts from many monitoring and change tools.
What it does: BigPanda sits between monitoring tools and the paging tool. It correlates events from more than 300 sources into incidents, enriches them with topology and change data, and passes a smaller set of incidents to PagerDuty, ServiceNow or another destination.
Strengths: Correlation across tools is the core product, so it handles alert volume that a paging tool's built-in grouping cannot. Change correlation points responders to the deploy or configuration change that preceded an alert storm.
Limits: BigPanda is not a pager on its own, so it adds a tool rather than replacing one. Correlation needs historical data and tuning before it performs well. The product targets enterprise volume and is rarely worth the cost below that.
Public pricing: Not public. Pricing is sales-led and based on data volume.
How should alert grouping be configured?
Alert grouping should be configured from the alert payload outward, starting with stable deduplication keys and ending with time-based grouping. Each layer removes a different kind of noise.
Deduplication keys come first. A key is the field, or set of fields, that marks two events as the same alert. A good key combines the check name, the service and the resource, such as disk_full:payments-db:replica-2. A key that includes a timestamp or a request ID never matches, so every event pages again.
Grouping windows come second. A window joins alerts that fire within a set time of each other into one incident. Five minutes is a common starting point for deploy-related storms, tuned against your own incident history. A window that is too long merges a morning failure with an unrelated afternoon one.
Routing rules come third. Route on the service or team tag that the monitor attaches, not on alert title text, because titles change when someone edits a monitor. Keep a catch-all route to a triage rotation, so an alert with a missing tag still reaches a person.
Suppression comes last. Maintenance windows silence known noise during planned work. Dependency suppression holds alerts from downstream services when an upstream service is already in an incident. Both need an expiry, because a suppression rule left in place after the work ends is how real failures go unpaged.
Review the rules monthly. Count the incidents that produced more than one page, and the pages that led to no action. Both numbers point to the rule that needs a change.
What should on-call schedules support?
On-call schedules should support the rotation patterns your team runs today and the ones it will need after the next hiring round. The list below names the features that separate a usable schedule from a spreadsheet with a phone number.
- Layered rotations. A primary and a secondary layer, with weekday and weekend patterns that differ.
- Follow-the-sun handoffs. Rotations that pass between time zones at set hours, so nobody carries a night pager in a region with daytime coverage.
- Overrides. One-click swaps for a shift, logged with who made the change.
- Shadow shifts. A way for a new engineer to receive pages without being the responder of record.
- Coverage gap checks. A warning before a shift starts with nobody assigned.
- Fairness reporting. Pages and out-of-hours interruptions per person per month, so load can be rebalanced.
- Calendar sync. Schedule export to Google Calendar or Outlook, so on-call shows next to meetings.
Every paging tool on this list supports layered rotations and overrides. Shadow shifts, coverage gap checks and fairness reporting vary by tool and tier, so check them against your rotation size during the trial.
Where does alert management stop?
Alert management stops at delivery. The tool proves that the right person knows something is wrong. It does not explain why the thing is wrong, and it cannot page for a failure that no monitor detects.
Three gaps follow from that boundary.
The first is the silent failure. A service that returns HTTP 200 with a wrong price never trips an error-rate alert. HyperProbe's piece on MTTD vs MTTR when the failure never raises an error walks through how detection time grows when the alert never fires.
The second is over-grouping. Aggressive grouping cuts pages, but it can merge two independent failures into one incident. The responder fixes the first, closes the incident and misses the second. Test grouping rules against incidents where two causes overlapped.
The third is the gap after the acknowledgement. The page names a service and a symptom. The engineer still has to find the cause, and that work usually takes longer than detection. The breakdown of where backend teams lose hours in a production incident breaks down the stages that follow the page.
How does alerting fit your stack?
Alerting fits between the monitors that detect a problem and the tools engineers use to diagnose it. The list below maps a common stack to the job each layer does.
- Datadog, Honeycomb, Grafana or Sentry detect the problem and raise the alert.
- PagerDuty or another tool from this list groups, routes and pages.
- HyperProbe captures the live code-level evidence the responder needs after acknowledging the page.
HyperProbe is an AI on-call agent for live production debugging, built on dynamic instrumentation. After the page, HyperProbe places a read-only probe on the suspect line in the running service and captures variable state the next time that line runs. Read-only probes do not pause production, change source code or require a redeploy. PII is redacted at the agent before capture.
HyperProbe does not route or page. It complements the alerting tool and starts where the alert ends. The guide to reducing MTTR on a backend service covers how the two layers shorten different parts of the incident.
Which alert tool should your team pick?
Pick an alert tool by replaying the last 30 days of real alerts through each shortlisted tool and measuring the pages that come out. The table below lists each criterion and the evidence a trial should return.
| Criterion | Evidence to collect during a trial |
|---|---|
| Noise reduction | Pages per real incident before and after grouping, on 30 days of replayed alerts |
| Routing accuracy | Share of replayed incidents routed to the owning team on the first try |
| Notification reliability | Delivery time for push, SMS and voice in each country where responders live |
| Escalation behavior | Time to second-tier escalation when the primary does not acknowledge |
| Billable users | The vendor's seat count for your actual roster file, including people listed only in schedules |
| Migration effort | Hours to rebuild routing rules, schedules and integrations from your current tool |
Three patterns usually settle the choice. Teams whose alerts all fire from one monitoring vendor get the most from that platform's pager, such as Datadog On-Call or Grafana IRM. Teams that run incidents in chat pick incident.io or Rootly so alert and response share one tool. Large organizations with complex routing stay on PagerDuty or add BigPanda in front of it.
Pricing models, contract terms and total cost get a full treatment in the companion buyer's guide to choosing alert management software.
Route fewer alerts to the right person
Good alert management sends one page, to one owner, with enough context to start. Choose the tool that does that on your own alert history, at a seat count that matches your real roster.
After the page lands, the work moves to finding the cause in running code. HyperProbe captures that evidence with read-only probes. Book a HyperProbe walkthrough to see it after a real alert on one of your services.
Frequently asked questions
What is alert management software?
Alert management software receives alerts from monitoring tools, removes duplicates, groups related alerts into incidents, routes each incident to the owning team and escalates until someone acknowledges. It delivers notifications by push, SMS, voice and chat. It sits between the tools that detect problems, such as Datadog or Grafana, and the engineers who respond.
What is the difference between alert management and incident management?
Alert management ends when the right person acknowledges the page. Incident management covers what happens next: the channel, roles, status updates, the timeline and the postmortem. PagerDuty, incident.io, Rootly and Grafana IRM sell both, but several of them price alerting and response as separate products or add-ons.
What is the cheapest alert management software?
Zenduty Starter lists at $5 per user per month on annual billing, with capped calls and texts. PagerDuty is free for up to 5 users, Grafana IRM is free for 3 active users, and incident.io has a free Basic plan with single-team on-call. Check notification caps and integration limits before using a free tier in production.
How do I reduce alert fatigue?
Start with stable deduplication keys, then add grouping windows, payload-based routing and maintenance windows that expire. Each month, count the incidents that produced more than one page and the pages that led to no action. Tune or delete alerts that never lead to action. Model-based grouping helps at high volume but needs testing against overlapping failures.
What replaces Opsgenie?
Atlassian moved Opsgenie's alerting and on-call features into Jira Service Management and Compass. Opsgenie support ends on April 5, 2027, and unmigrated data is deleted that day. Teams outside the Atlassian stack often move to PagerDuty, incident.io, Rootly, Grafana IRM or Better Stack. Export alert history and rebuild routing rules before the cutover.
Does HyperProbe send alerts?
No. HyperProbe is an AI on-call agent for live production debugging, and it does not route or page. HyperProbe works after the alert, when the responder needs to know why a service failed. It places read-only probes on suspect lines in running code and captures variable state without a redeploy, alongside tools such as PagerDuty.
Written by
Founder
Shailendra Singh is the founder and CEO of HyperProbe (YC S26), an AI on-call agent that debugs production incidents by capturing evidence directly from running services. He has over a decade of experience building and running production systems, starting at Applied Materials before moving into startup operating and engineering leadership roles, including at a company that later became a unicorn. He founded and ran Transporter.city from 2017 to 2021, then spent three years building HyperTest before founding HyperProbe with Karan Raina. He writes about production debugging and incident response.
RELATED READS