What is Root Cause Analysis?

Quick Answer
Root cause analysis (RCA) is a structured process for finding the underlying condition that caused a problem, so the fix stops it from coming back. In software, RCA moves from problem definition to evidence, hypotheses, confirmation, a verified fix, and a shared postmortem. Investigations usually stall at confirmation, because logs and metrics rarely hold the variable state that proves a hypothesis.
Root cause analysis (RCA) is a structured method for identifying the fundamental reason a problem occurred and removing it, so the same failure does not return. For engineering teams, RCA is the step that separates a patched incident from a resolved one.
The cost of skipping it is measurable. ITIC's 2024 Hourly Cost of Downtime Survey, which polled more than 1,000 firms worldwide, found that one hour of downtime costs more than $300,000 for over 90% of mid-size and large enterprises, before any legal penalties. An incident that is patched but never understood can return and run up that bill again.
What does root cause analysis mean?
Root cause analysis means tracing a problem back past its visible symptoms to the condition that set the whole chain of events in motion. ASQ defines a root cause as the core issue that starts that chain, and treats RCA as a collection of approaches for finding that issue and eliminating it through process improvement.
The discipline began in manufacturing and safety engineering. Software teams apply the same logic to production outages, failed deploys, and data errors that never raise an exception.
A practical test follows from the definition. Removing a true root cause stops the problem from recurring. Leaving it in place allows the problem to return.
Root cause vs symptom vs trigger
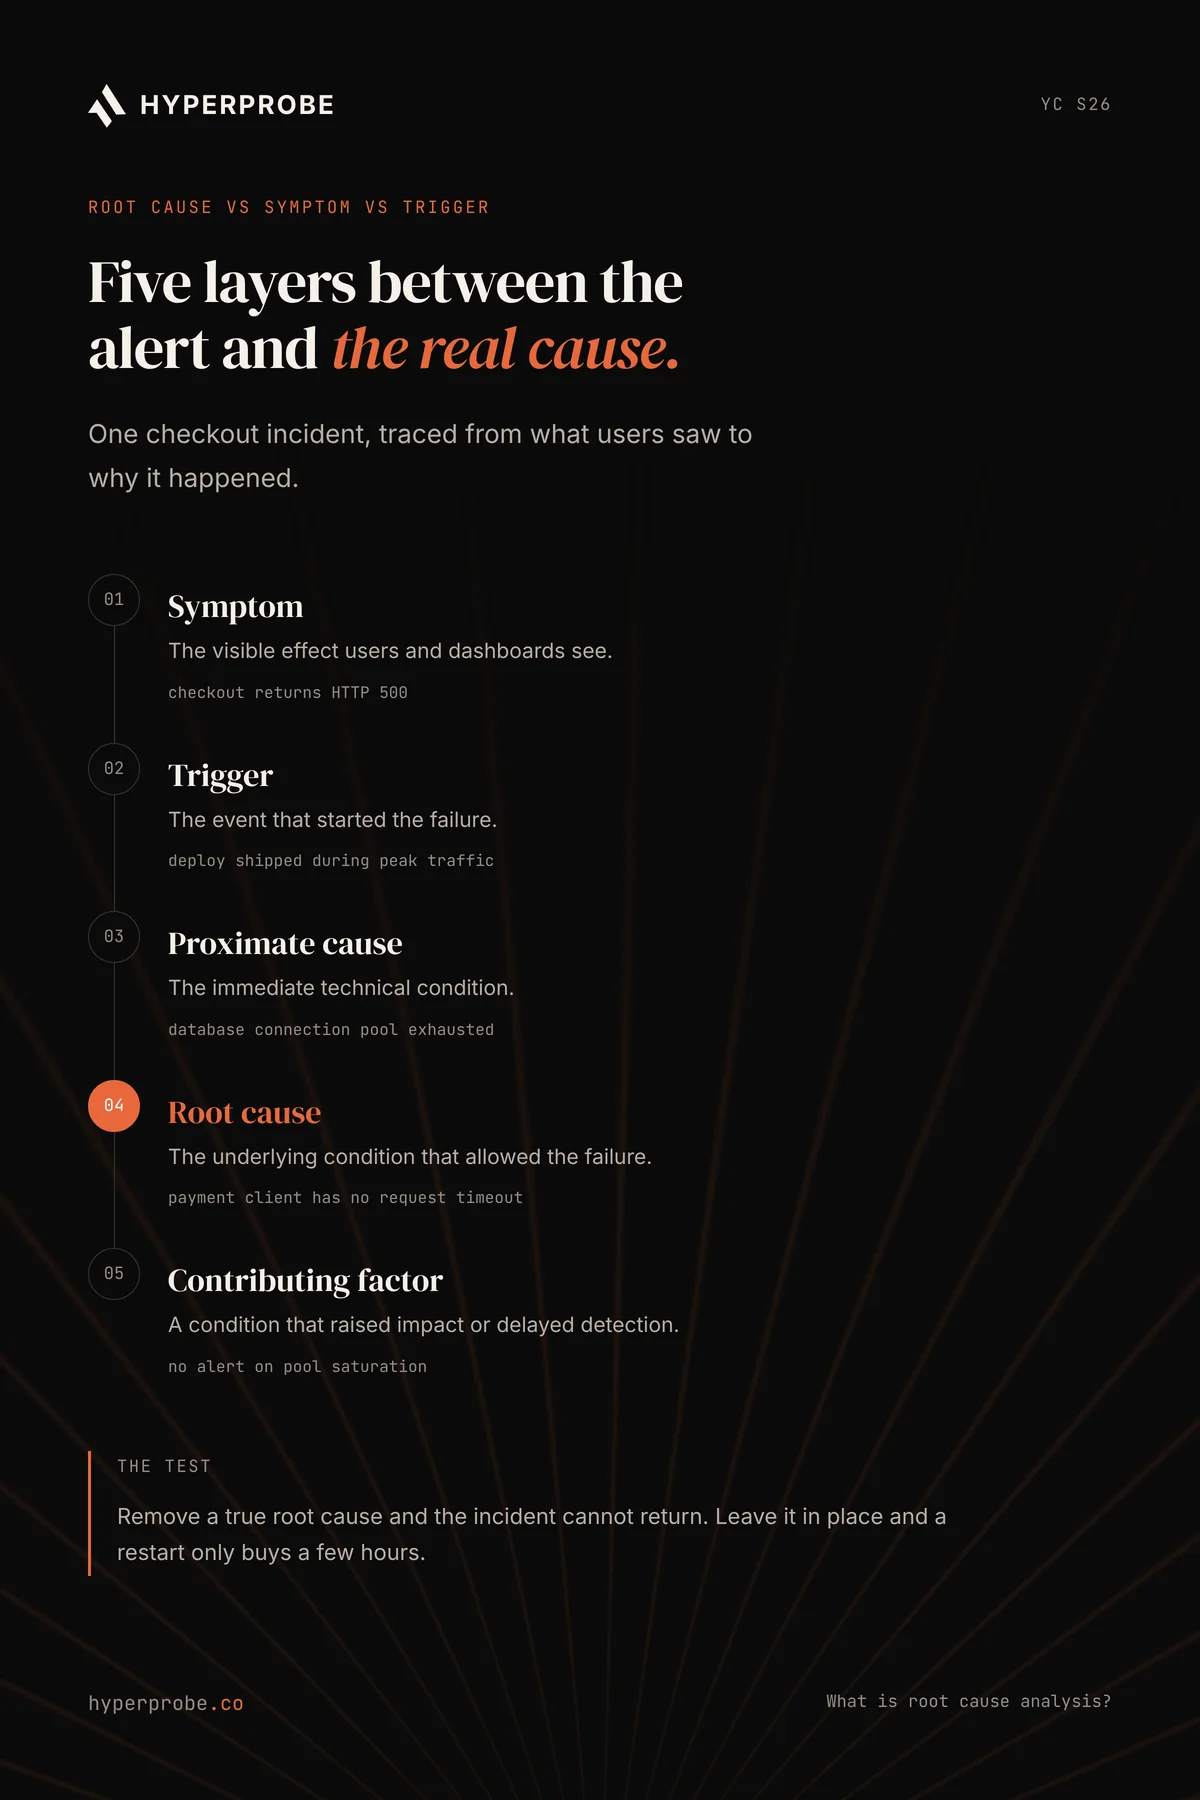
A symptom is what users and dashboards see, and a root cause is the condition underneath it. Keeping the terms separate stops a team from closing the investigation at the first plausible answer.
The table below applies each term to one example incident in a checkout service.
| Term | Meaning | Example |
|---|---|---|
| Symptom | The visible effect | Checkout requests return HTTP 500 errors |
| Trigger | The event that started the failure | A deploy shipped during peak traffic |
| Proximate cause | The immediate technical condition | The database connection pool is exhausted |
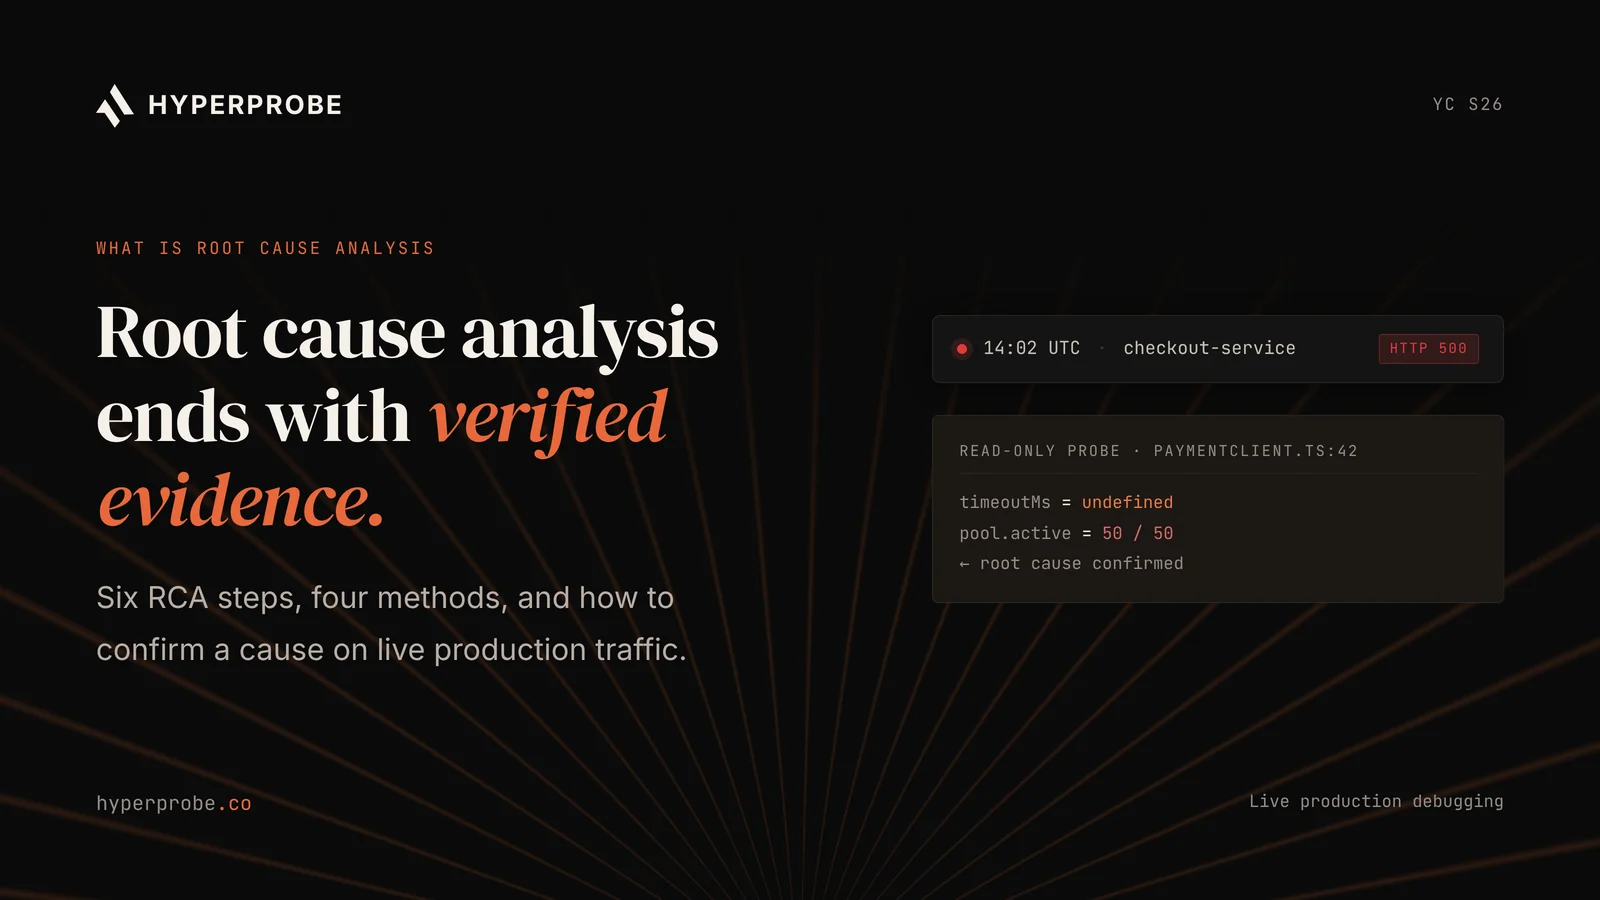
| Root cause | The underlying condition that allowed it | The payment client has no request timeout, so slow calls hold connections open |
| Contributing factor | A condition that raised impact or delayed detection | No alert exists for connection pool saturation |
Why does root cause analysis matter?
Root cause analysis matters because a fix aimed at a symptom leaves the cause in place, and the incident returns. Restarting the checkout service in the example above clears the exhausted pool for a few hours. The missing timeout is still there, and the next slow response from the payment provider produces the same outage.
Each recurrence pages the on-call engineer again and pulls developers away from planned work. Each one also raises mean time to resolution (MTTR), the average time from detection to a confirmed fix, because responders re-learn the same failure under pressure.
RCA also produces organizational learning. The Google SRE book describes blameless postmortems as a tenet of SRE culture, where the analysis focuses on contributing causes without blaming an individual or team. That focus makes engineers willing to report what happened, which is the raw material every RCA depends on.
What are the RCA process steps?
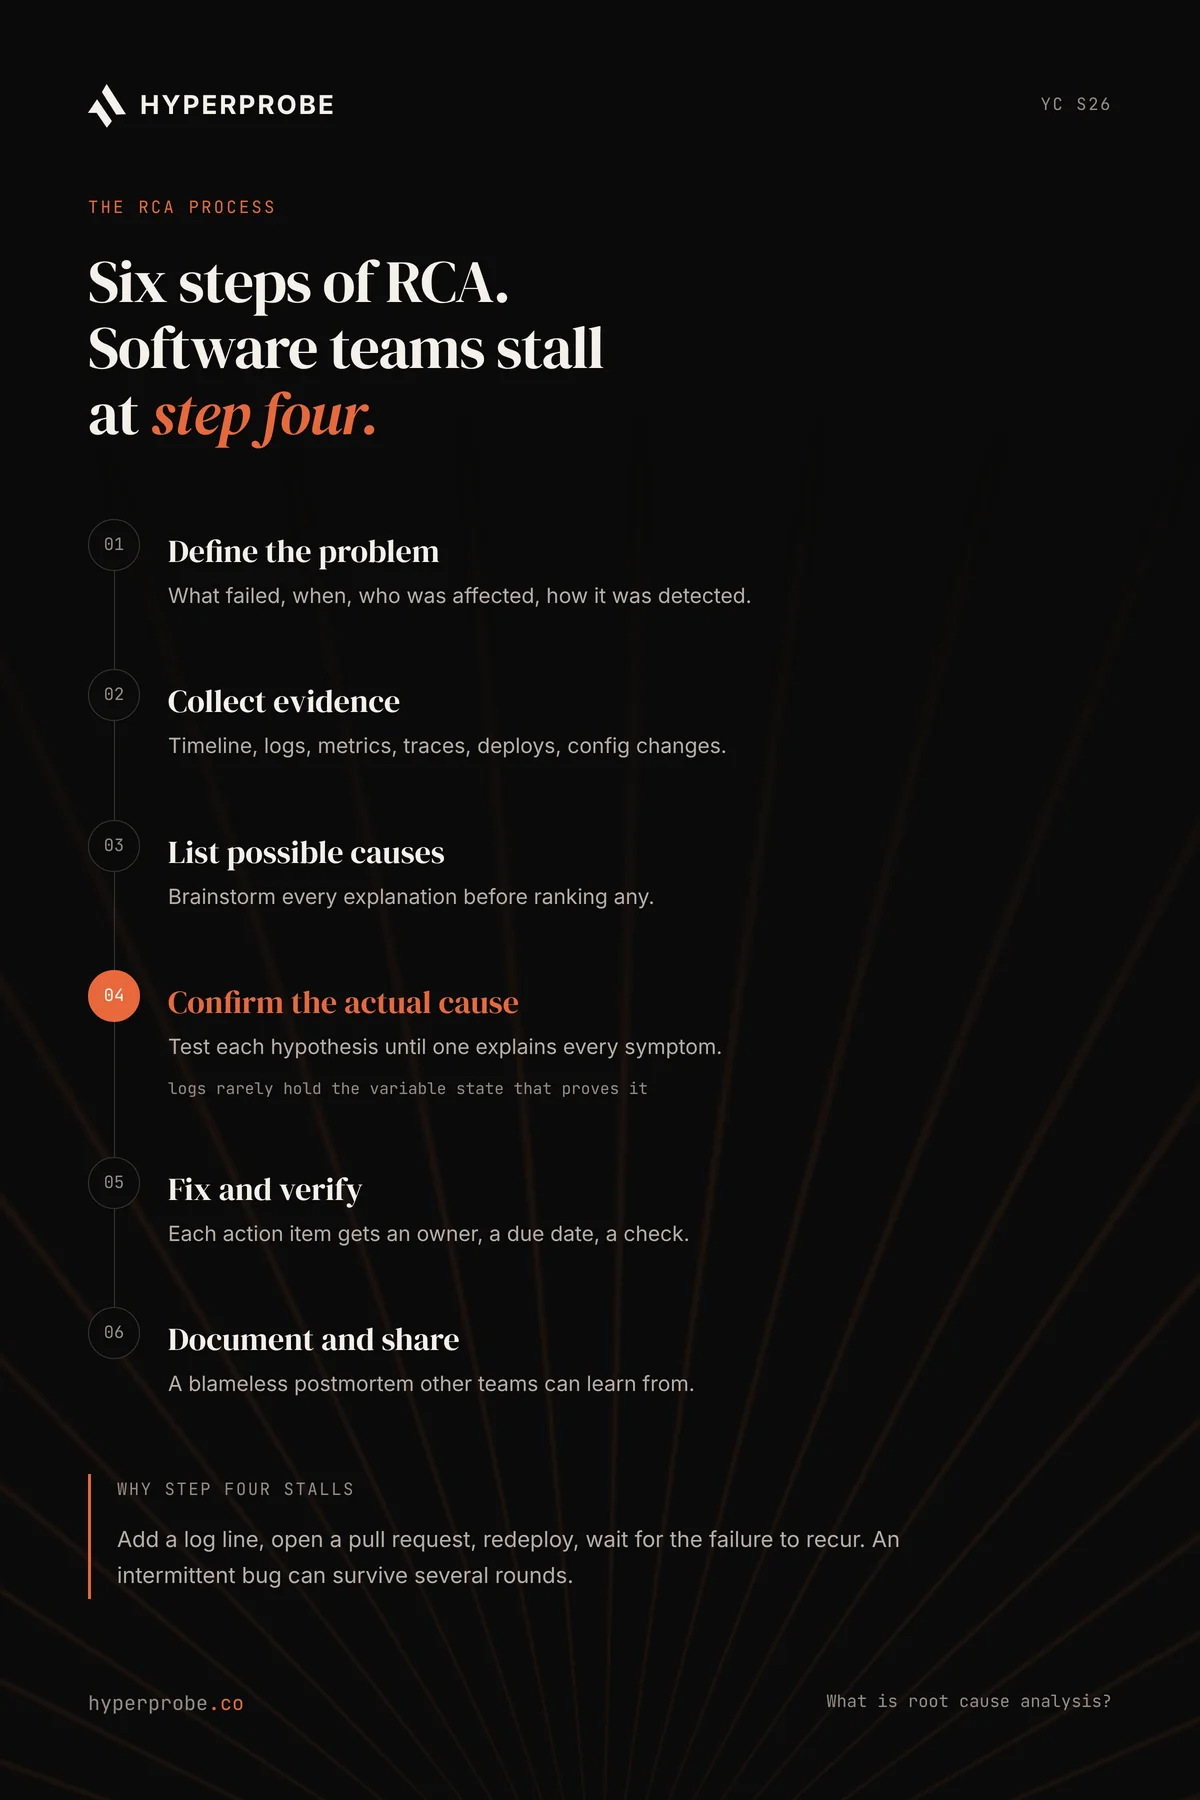
The RCA process follows a consistent sequence across industries, with small differences in naming. The six steps below combine the quality-management framework published by ASQ with standard SRE postmortem practice.
- Define the problem. Write down what failed, when it started, who was affected, and how the failure was detected. A precise problem statement keeps the investigation from drifting.
- Collect evidence. Assemble the timeline, logs, metrics, traces, recent deploys, and configuration changes. Evidence gathered early saves the team from reconstructing events from memory.
- List possible causes. Brainstorm every plausible explanation before ranking any of them. Early commitment to one theory is a common source of wrong conclusions.
- Confirm the actual cause. Test each hypothesis against evidence until one explains every observed symptom. This is the step where software investigations spend the longest.
- Fix and verify. Apply a fix that addresses the root cause, then confirm the problem no longer reproduces. Give each action item an owner, a due date, and a verification step.
- Document and share. Record the findings in a postmortem so other teams can apply the lesson to their own services.
Which root cause analysis methods work best?
The right root cause analysis method depends on how complex the incident is and how much time the team has. Fast techniques fit an active P0 or P1 incident, and structured techniques fit the postmortem.
The table below compares four methods common in software teams.
| Method | How it works | Best for | Limitation |
|---|---|---|---|
| 5 Whys | Ask "why" repeatedly until reaching a controllable cause | Fast, single-cause incidents | Can follow one path and miss parallel causes |
| Fishbone (Ishikawa) diagram | Group possible causes into categories on a diagram | Incidents with several interacting causes across teams | Takes time and input from several people |
| Timeline analysis | Order every event and change by timestamp | Establishing sequence during and after an incident | Shows order, which does not prove causation |
| Change analysis | Compare the failing state to the last known good state | Failures that follow a deploy or config change | Weak when nothing obviously changed |
Here is a 5 Whys chain for the checkout example:
- Why did checkout return 500 errors? The database connection pool was exhausted.
- Why was the pool exhausted? Requests held connections while waiting on the payment provider.
- Why did requests wait so long? The payment provider responded slowly after the deploy raised call volume.
- Why did slow responses hold connections indefinitely? The payment client had no timeout configured.
- Why was there no timeout? The service template did not require one, and code review did not check for it.
The fifth answer points to a process gap. Adding a timeout requirement to the template protects every service built from it, including services that have not failed yet.
How does RCA work for software incidents?
RCA for software incidents happens in two phases. During the incident, responders use a quick timeline and a short 5 Whys to guide mitigation. After service is restored, the team runs a fuller analysis and writes a postmortem.
Distributed systems complicate the idea of a single root cause. Richard Cook's paper How Complex Systems Fail argues that failures in complex systems require several flaws to combine, and the Google SRE book writes "root cause(s)" in the plural for the same reason. A good software RCA lists each contributing factor with its own action item.
Coordination adds time as well. An incident that crosses service boundaries needs input from several owning teams, each with partial context. HyperProbe covers that problem in detail in why root cause analysis takes so long across teams.
Why do software RCAs stall?
Software RCAs stall at step four, confirmation, because the existing telemetry does not contain the evidence a hypothesis needs. Logs record what a developer chose to log months earlier. Metrics show that a pool filled up, without showing which request held each connection or what value a variable carried at that moment.
The common workaround is to add log lines, open a pull request, wait for a deploy, and wait again for the failure to recur. Each loop can cost hours, and the incident stays open the whole time.
The failure types below resist that workaround the hardest.
- Intermittent errors. A 500 that appears on a small share of requests and never in staging can survive several log-and-redeploy rounds. The HyperProbe guide to root cause analysis tools for intermittent 500 errors covers this case.
- Production-only bugs. Failures that depend on real customer data, real traffic volume, or a specific third-party response often cannot be reproduced in staging at all.
- Silent failures. Code that returns a wrong result without throwing leaves nothing in the error logs to start from.
How to confirm a root cause faster
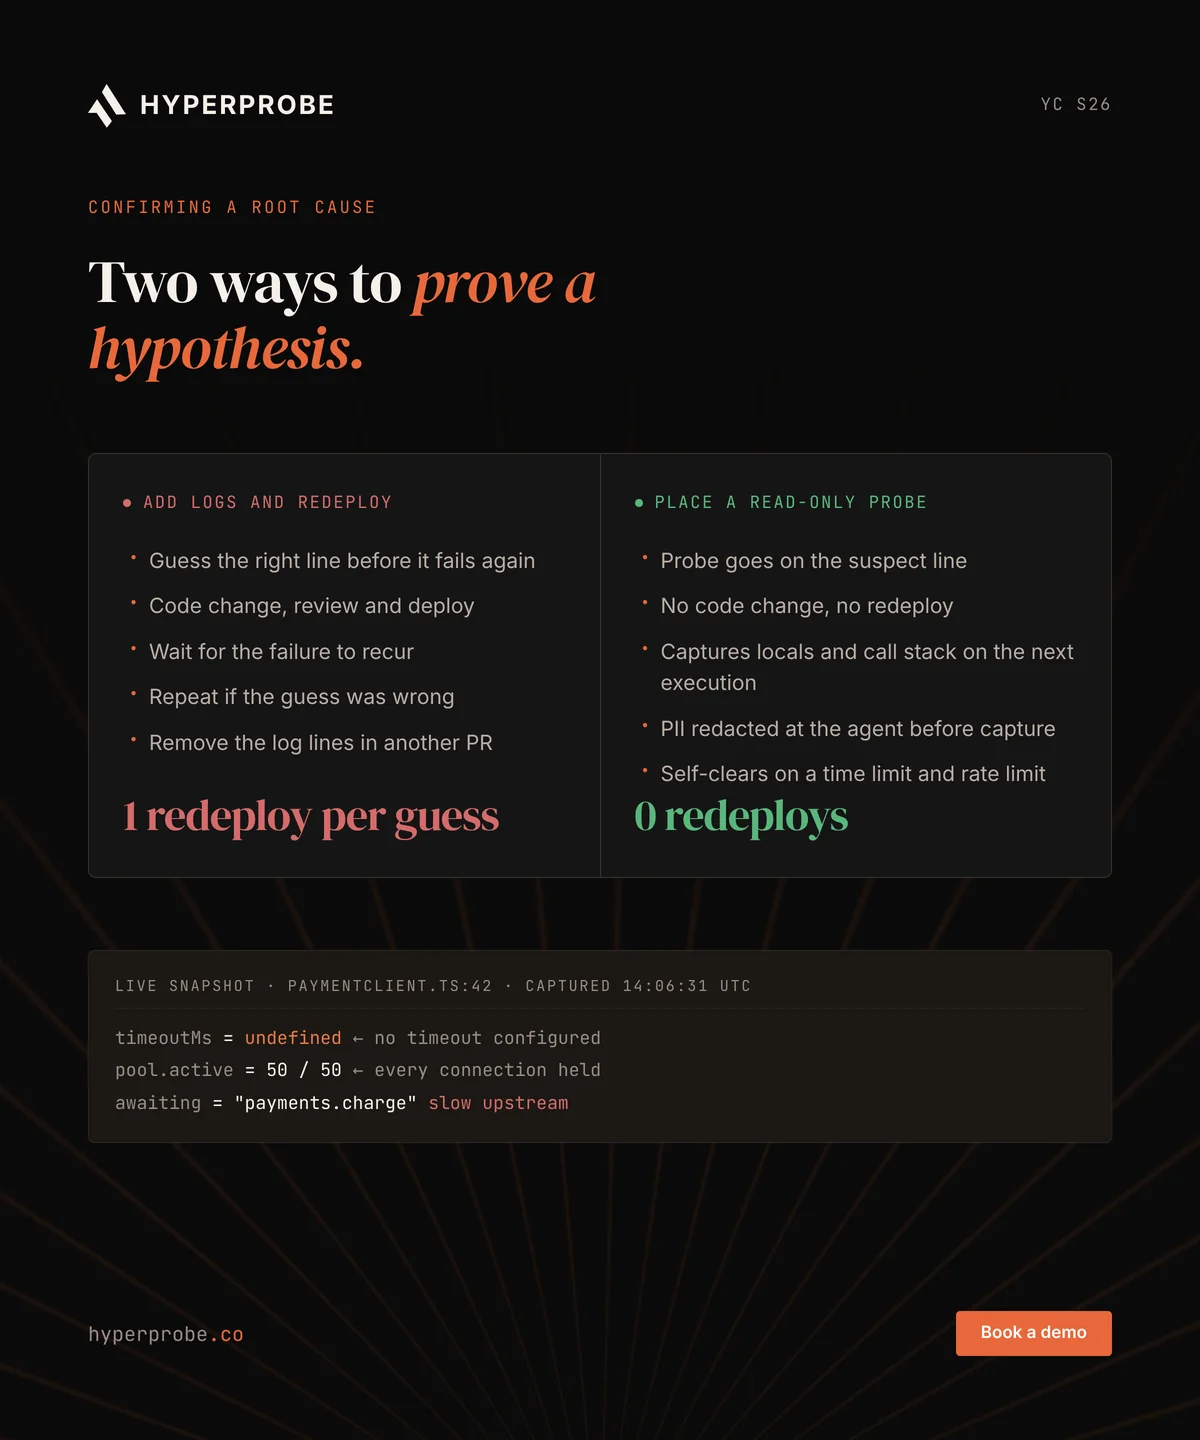
The fastest way to confirm a root cause is to capture the variable state at the suspect line of code while the service handles live traffic. Reproducing the failure in staging or toggling a feature flag can also work, but production-only bugs often resist both.
The tool for this is a non-breaking breakpoint, also called a probe. A probe is a read-only breakpoint that copies local variables and the call stack when a line executes, without pausing the request or changing what the code does. Dynamic instrumentation, the technique of adding this kind of capture to running code without a redeploy, makes it possible. The walkthrough on how to inspect live production variables without logs shows the mechanics step by step.
The table below compares the two ways to confirm a hypothesis in production.
| Add logs and redeploy | Place a read-only probe | |
|---|---|---|
| Code change | Yes, with a pull request and review | No |
| Redeploy | Yes, once per guess | No |
| Data captured | Only the fields someone chose to log | Local variables and call stack at that line |
| Wrong guess | Another full log, review, and deploy cycle | Move the probe to a different line |
| Cleanup | Remove the log lines in another change | The probe self-clears on a time limit and rate limit |
Can AI automate root cause analysis?
AI can automate the evidence gathering and confirmation steps of root cause analysis, and the quality of the result depends on the evidence the AI can reach. An assistant that only reads existing logs and traces produces a likely cause. An agent that can also capture runtime state can test that likely cause before reporting it.
The criteria below separate AI tools that confirm a root cause from tools that suggest one.
- Evidence used. Logs and traces only, or captured runtime state as well.
- Actions allowed. Read-only access, or write access to production systems.
- Approval. Whether a human approves each probe or action before it runs.
- Audit trail. Whether every action is logged and reviewable after the incident.
- Deployment model. Vendor cloud only, private VPC, or self-hosted.
- Pricing clarity. Whether pricing is published and how it scales as services grow.
HyperProbe is an AI on-call agent built on this model. When an alert fires, the agent reads the logs and traces already in your observability stack. Where that data does not explain the failure, it places a read-only probe on the suspect line, captures the state on the next execution, and checks the diagnosis against that evidence before returning it. An engineer reviews the confirmed root cause and commits the fix. For a wider view of the category and how to evaluate it, see the guide to the best AI SRE tools.
How does RCA reduce MTTR?
RCA reduces MTTR in two ways: it shortens confirmation on the current incident, and it removes repeat incidents that would each restart the clock. Confirmation is the step where software teams lose the most time, so faster evidence has the largest effect on resolution time.
There is no defensible industry average for the time saved, so calculate it from your own incident history. Multiply the redeploy loops per incident by the hours each loop takes, then by the number of engineers working the incident. That figure is the engineering time a no-redeploy capture removes from each incident, before counting the downtime cost of the hours the incident stayed open.
What are the limits of runtime capture?
Runtime capture has real limits, and knowing them helps decide where it fits in an RCA. The points below describe what a line-level probe cannot do and what it costs.
- It captures future executions only. A probe cannot replay a request that passed before the probe was placed, so a one-off failure that never recurs needs other evidence.
- It sees application code, not the network. DNS errors, load balancer misconfiguration, and network-layer attacks sit outside what a line-level probe can observe.
- It adds some load. HyperProbe measures under 1% CPU overhead at 3,000 requests per second, with about 50MB of memory and no measurable added latency.
- It touches real data. Captured variables can contain customer information, which is why redaction has to happen before any data leaves the service.
How do you keep RCA data safe?
Safe production RCA depends on controls that apply before any captured data leaves the running service. HyperProbe enforces the controls below on every probe.
- Read-only probes do not pause production, change source code or require a redeploy.
- PII is redacted at the agent before capture.
- Probes self-clear on a time limit and rate limit.
- Commit SHA alignment is enforced before a probe attaches.
Enterprise teams can use private VPC or self-hosted deployment, so captured data stays inside their own environment. The guide on how to debug production without exposing customer PII covers the redaction model in detail.
Where does runtime capture fit your stack?
Runtime capture fits on top of the observability, error tracking, and paging tools a team already runs. HyperProbe reads their logs, traces, and alerts first, and adds a probe only when that data does not explain the failure. Responders keep their current alerting and on-call workflow, and the existing stack keeps doing its job.
How do you choose an RCA approach?
Choose an RCA approach by matching the incident type to the evidence that would confirm its cause. The table below pairs common situations with a method and the evidence each one needs.
| Situation | Method | Evidence that confirms the cause |
|---|---|---|
| Single failure right after a deploy | Change analysis plus 5 Whys | Diff between the last good release and the failing one |
| Several services and teams involved | Fishbone diagram in the postmortem | Shared timeline with input from each owning team |
| Intermittent or production-only bug | Runtime capture at the suspect line | Variable state from a failing execution |
| Recurring incident with no clear owner | Timeline analysis across past incidents | A contributing factor common to several postmortems |
Root cause analysis ends with verified evidence
Root cause analysis is complete when a hypothesis has been confirmed against evidence and the fix has been verified in production. Methods such as the 5 Whys and fishbone diagrams produce strong hypotheses, and captured runtime state from the failing line confirms which one is correct.
HyperProbe is built for that last step. Book a 30-minute walkthrough on your own service and your own incident, and see a confirmed root cause before the call ends. The first incident we work with you is free.
Frequently asked questions
Is root cause analysis the same as a postmortem?
No. Root cause analysis is the investigation that identifies why an incident happened. A postmortem is the written record of the incident, which includes the RCA findings along with the impact, the timeline, the mitigation steps, and the follow-up action items with owners.
How long does root cause analysis take?
A quick 5 Whys during an active incident can take minutes. A full RCA for a complex manufacturing or quality problem can span weeks to months, according to ASQ. Software RCAs stretch longest when the team cannot confirm a hypothesis with production evidence and has to redeploy new logging.
Can an incident have more than one root cause?
Yes. Incidents in distributed systems usually result from several contributing factors interacting, which is why the Google SRE book refers to root cause(s) in the plural. Each contributing factor should receive its own action item, owner, and verification step in the postmortem.
What is a non-breaking breakpoint?
A non-breaking breakpoint is a read-only capture point placed on a line of running code. When that line executes, it records local variables and the call stack without pausing the request or changing program behavior. Engineers use it to inspect live production state without adding log lines or redeploying the service.
Can AI do root cause analysis on production incidents?
Yes, within the limits of the evidence it can reach. AI tools that read only logs and traces return a likely cause. An AI on-call agent such as HyperProbe can also place read-only probes on running code, capture the variable state at the failing line, and confirm the diagnosis against that evidence before an engineer commits the fix.
How do you know you have found the real root cause?
A real root cause explains every observed symptom, and removing it stops the problem from recurring. Confirm the cause against evidence, such as captured variable state from a failing execution or a reproduced failure, then verify in production that the fix holds under real traffic.
Written by
Founder
Shailendra Singh is the founder and CEO of HyperProbe (YC S26), an AI on-call agent that debugs production incidents by capturing evidence directly from running services. He has over a decade of experience building and running production systems, starting at Applied Materials before moving into startup operating and engineering leadership roles, including at a company that later became a unicorn. He founded and ran Transporter.city from 2017 to 2021, then spent three years building HyperTest before founding HyperProbe with Karan Raina. He writes about production debugging and incident response.
RELATED READS