How to debug production when you cannot store customer data


Quick Overview:
You can debug production without storing customer data by keeping what your code did with a payload rather than the payload itself. This guide works up a ladder of techniques on a real-world bug: existing telemetry and aggregates, hashed stand-ins, scoped debug flags with an expiry, and redacted line-level captures with dynamic instrumentation. It ends with the guardrails your security team will ask about.
An order on your payments service just posted the wrong total. The bug only shows up in production, and the customer is on the phone with support. Your data policy says no customer payloads in logs, dumps, tickets or screenshots. Every regulated team hits this sooner or later. The usual answer is a redeploy with extra logging that someone has to remember to remove.
There is a better way to debug production when you can't store customer data. Keep what the code did with the payload, and leave the payload out. Every diagnostic you add should also have a scope and an expiry. This guide treats it as a ladder, from techniques that create no new data up to capturing a live variable at the line that went wrong. The wrong-total order is the running example.
What the policy forbids
"Cannot store customer data" is rarely a single rule. Under GDPR, personal data must be limited to what the purpose needs and kept in identifiable form no longer than that. The regulation calls this data minimization and storage limitation. PCI DSS adds cardholder data, HIPAA adds health information, and your security team usually adds its own list on top.
The OWASP Logging Cheat Sheet gives the practical version. It says never to log session identifiers, access tokens, passwords or encryption keys, and the same goes for cardholder data and health or government IDs. Names, emails and phone numbers need masking or pseudonymization before they are written anywhere.
The stakes are concrete. IBM's 2025 report puts the average cost of a breach in the United States at USD 10.22 million. A debug log full of raw payloads is the kind of secondary store that turns a small incident into a reportable one.
Read the policy closely, though. It forbids keeping customer payloads. It says nothing about learning what your code did with them, and that gap is where debugging happens.
The ladder at a glance
| Rung | What you keep | What it still can't show you |
|---|---|---|
| Existing telemetry | Error rates, traces, histograms, grouped counts | Which value inside the request was wrong |
| Hashed stand-ins | Keyed hashes, types, lengths, magnitudes, branch | The exact value that separates two hypotheses |
| Scoped debug flag | Extra structured fields for one customer, for 30 minutes | Raw values that the redaction rules block |
| Line-level capture | Local variables at one line, redacted in the process | Executions from before the probe was placed |
Climb only as far as the bug needs. For a wrong-value bug, the second rung often narrows it to a few lines.
Start with what you already have
The cheapest diagnostic creates no new data. Before you touch the service, use up the telemetry you already collect under an approved regime. Error rate and p95 latency by endpoint show the wrong totals come from POST /orders/{id}/capture and started after Tuesday's deploy. A trace shows the handler called the pricing service, then the currency service, and then wrote the result.
Go in a safe order. Check existing dashboards first, then run read-only queries against a replica with timeouts and row limits, then turn on sampled diagnostics. Leave heap dumps for last and drain the instance before you take one, since a dump can contain credentials and full request bodies.
Aggregates do a lot of the work here. A histogram of order_total / amount_received across the affected window shows a tight cluster at 100x without exposing a single order. A grouped count by currency code shows the ratio only appears on one currency. An aggregate can go into a ticket, and a payload cannot.
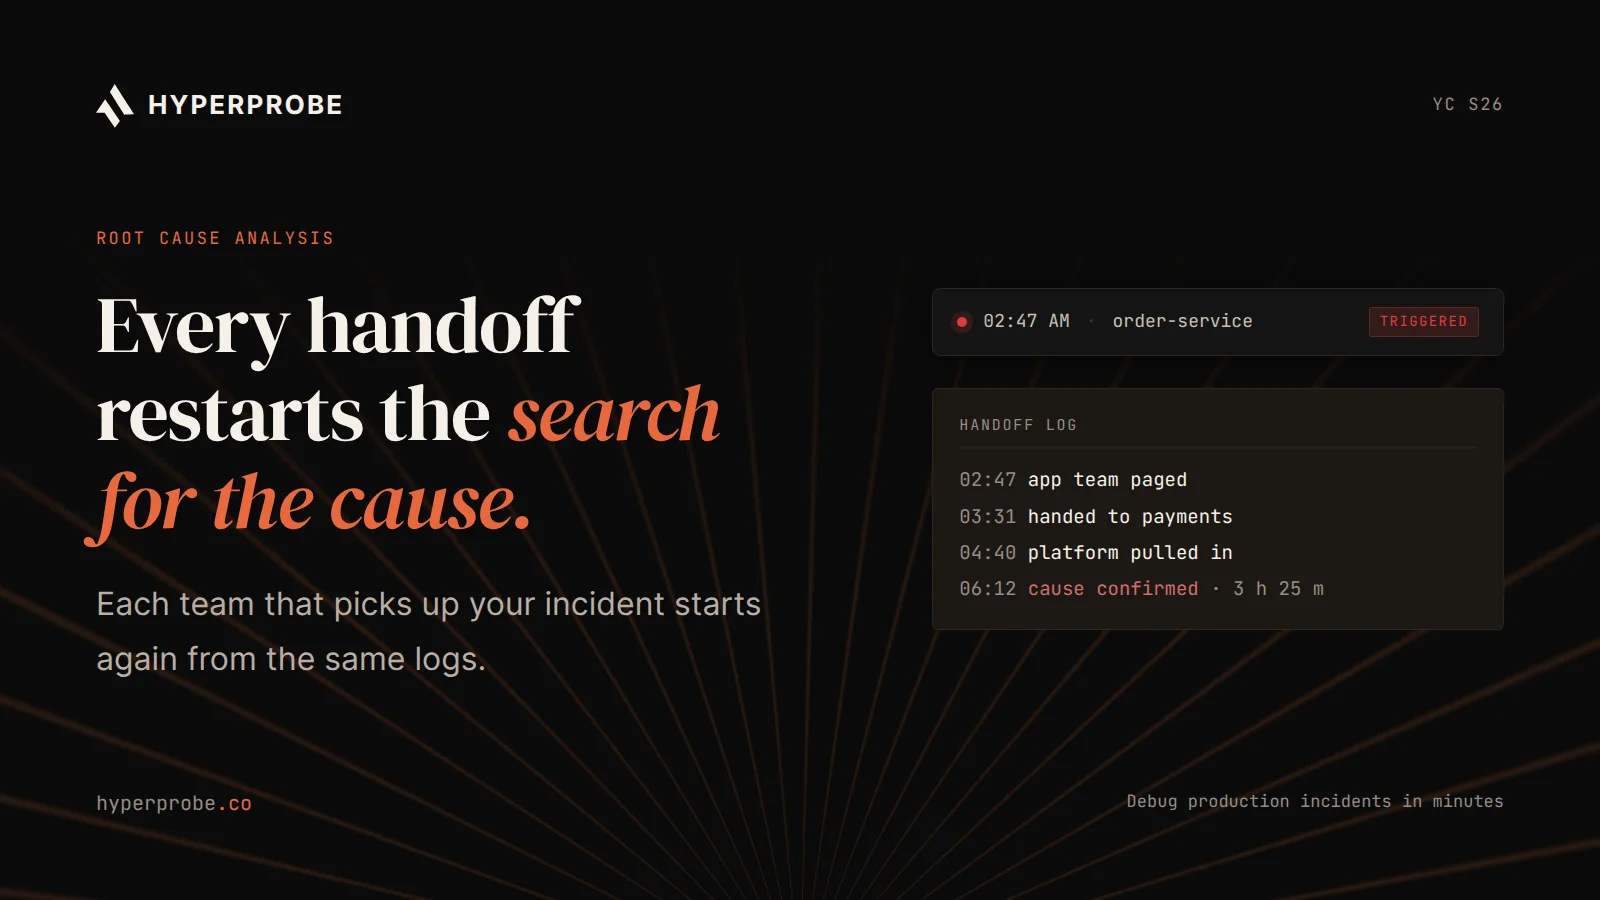
What this layer can't do is show you the value. You know the handler, the dependency and the ratio. You still don't know whether the pricing service returned cents, the currency service returned dollars, or the handler multiplied twice.
Log a stand-in for the value
The next rung replaces a sensitive value with something you are allowed to keep. OWASP's cheat sheet permits hashed session identifiers for tracking, and the same idea works for any identifier you need for correlation. Log a stable hash instead of the customer ID, and you can group every event for one customer without writing down who the customer is.
Use a keyed hash with a per-environment secret, so nobody who knows the ID format can reverse it:
import hmac, hashlib, os

KEY = os.environ["LOG_HASH_KEY"].encode()

def log_ref(value: str) -> str:
    return hmac.new(KEY, value.encode(), hashlib.sha256).hexdigest()[:16]

log.info("capture.mismatch",
         customer_ref=log_ref(customer_id),
         currency=order.currency,
         total_magnitude=len(str(int(order.total))),
         received_magnitude=len(str(int(amount_received))),
         branch="currency_converted" if converted else "passthrough")
Nothing in that line is customer data. The hash lets you correlate events. The magnitudes tell you the two numbers differ by two digits, and the branch tells you the conversion path ran. The UK Home Office engineering standard makes the same point: log named fields rather than whole objects, and never log full request or response payloads in production. Logging the whole object "for now" is how card numbers end up in a log index.
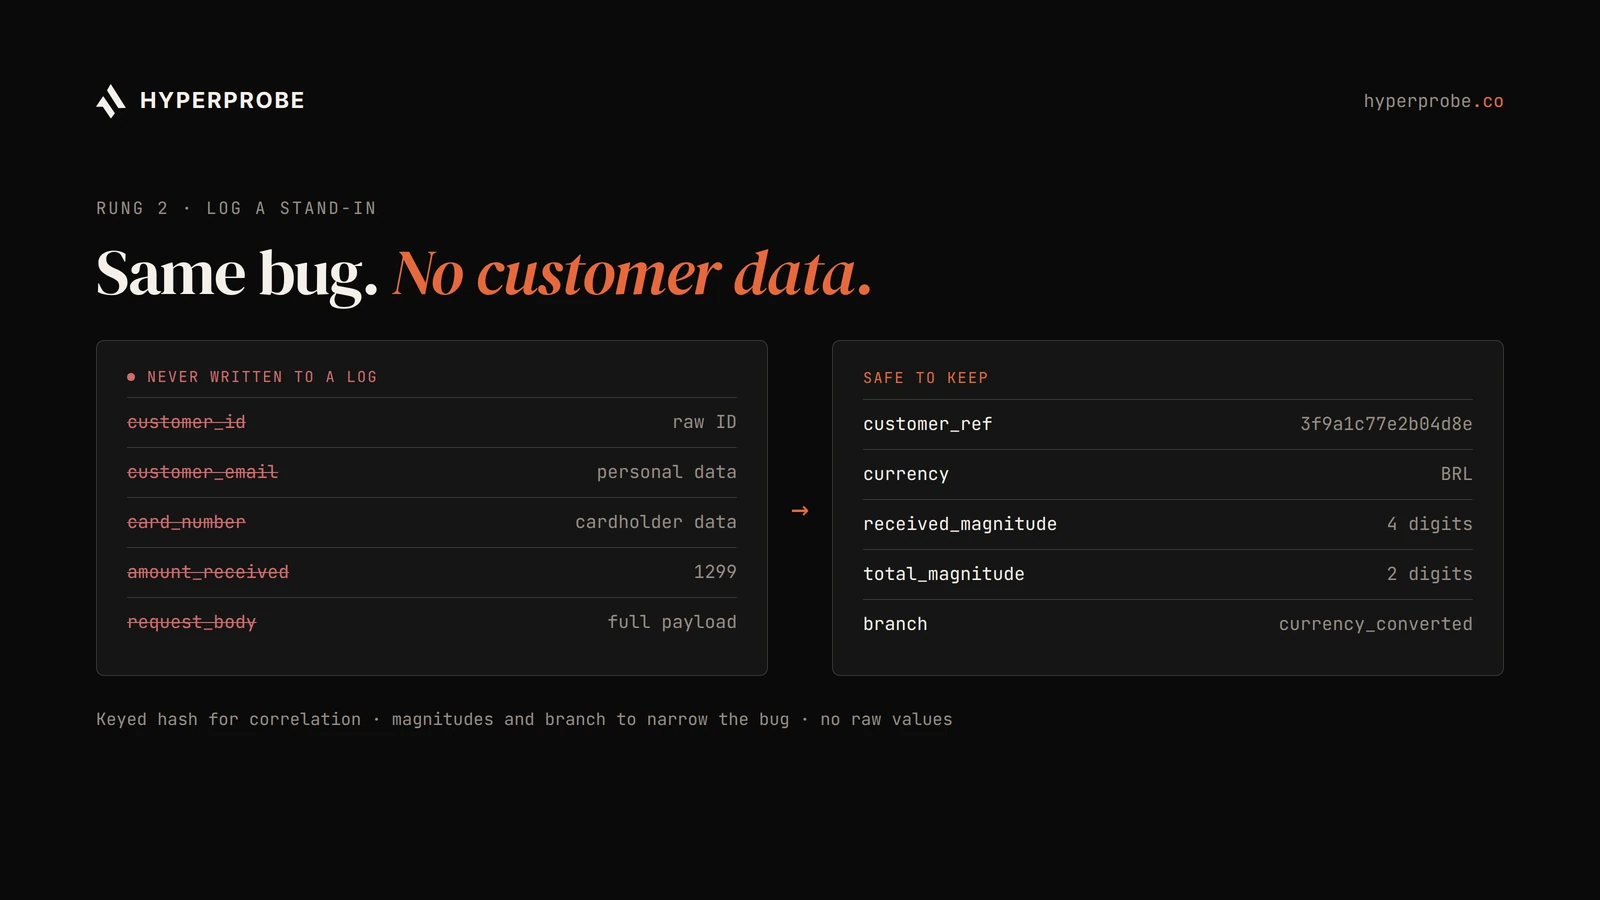
Type, length, sign and order of magnitude are all safe to keep, and so is which branch ran. Together they usually narrow a bug to a few lines. The blind spot arrives when you need the actual wrong value to tell two hypotheses apart.
Turn on detail for one request
Blanket debug logging in production is off the table, and AWS's logging guidance says to keep debug levels off there. A scoped version is fine. Pair a feature flag with a log filter so DEBUG applies to one account or one request while everything else stays at INFO. Terse Systems documented this pattern using flag-driven markers that override the log level per call.
The bounds matter more than the flag:
- Scope. Target one user, session or request, never the whole service.
- Expiry. Clear the flag automatically after a default window of around 30 minutes.
- Budget. Cap the number of events and clear the flag when the cap is hit.
- Audit. Write every toggle to an immutable log with who turned it on, for what scope and for how long.
- Masking. Send verbose output through the same PII masking as normal logs.
Debug mode that skips the masking layer is a policy breach with a nicer name.
flag: debug.capture_handler
scope:
  customer_ref: "3f9a1c77e2b04d8e"   # hashed, not raw
expires_in: 30m
budget_events: 500
emit_fields: [currency, total_magnitude, received_magnitude, branch, pricing_status]
For the wrong-total order, you enable this for the affected account's hash and ask support to have the customer retry. You collect a few hundred structured events and let the flag expire. Scoped logging is still logging, though. Every field goes through the redaction rules, so it still can't show you amount_received as a raw number if that number counts as customer financial data.
Capture state at the line itself
The top rung captures local variables at a chosen line on the next matching request. Redaction runs inside the process before anything leaves it. Dynamic instrumentation does this with read-only probes rather than breakpoints, so the request continues and the service keeps serving traffic.
Good redaction works at three levels. It matches identifier names, so anything called password, token or email is replaced before capture. It matches types, so instances of a sensitive class are never serialized. It also matches value patterns, so a card number or an email address is caught even when the variable has an innocent name. Redacted values never leave the host.
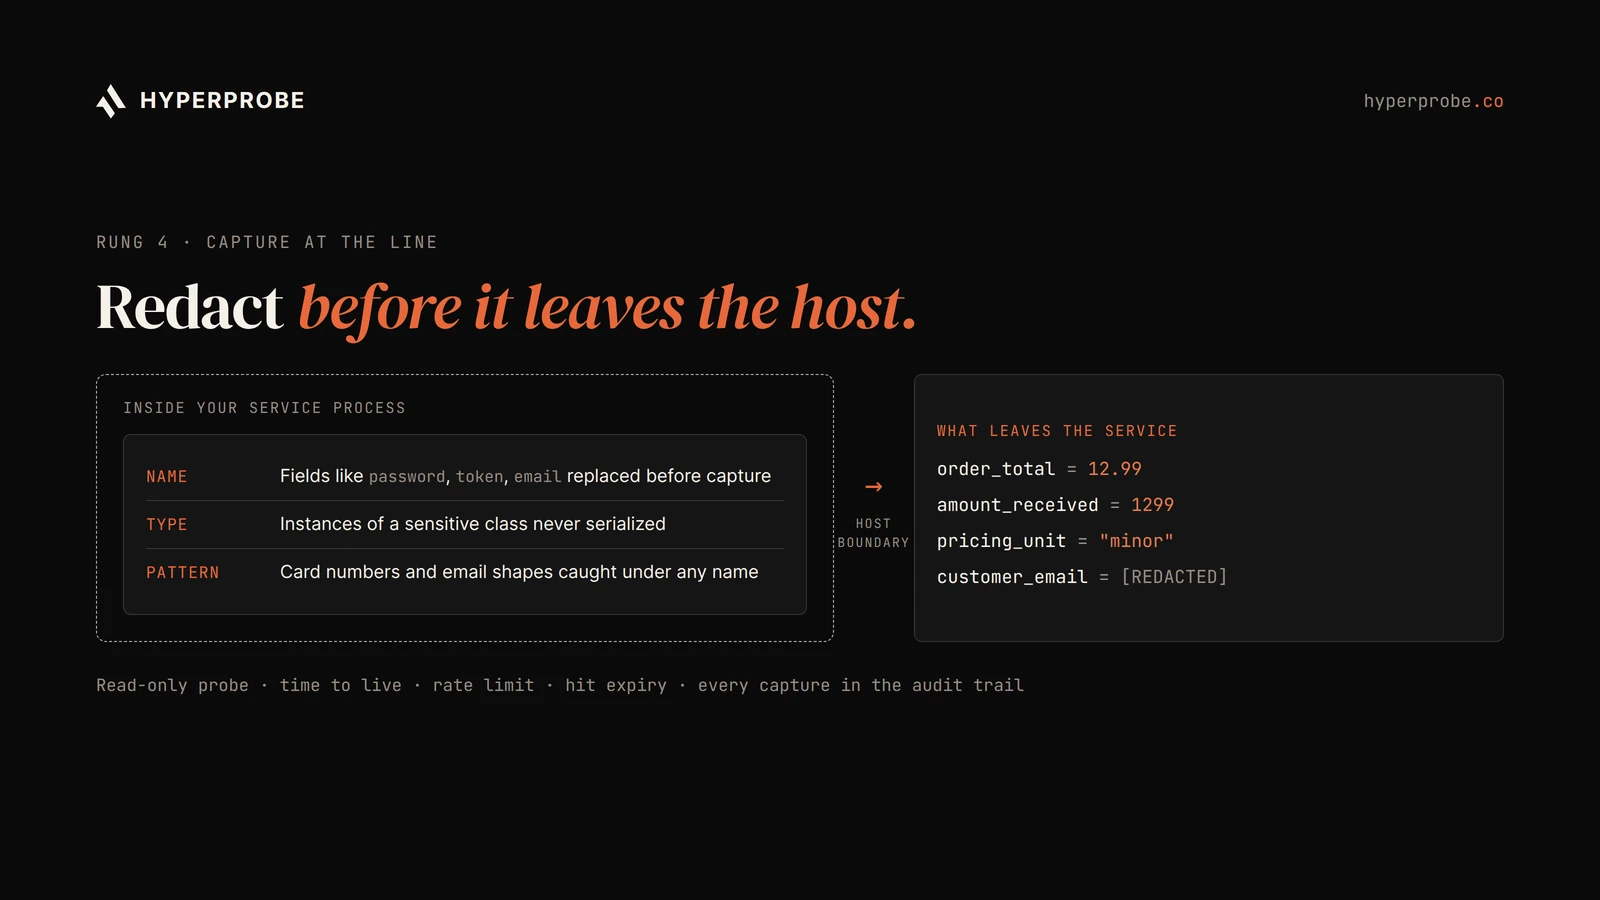
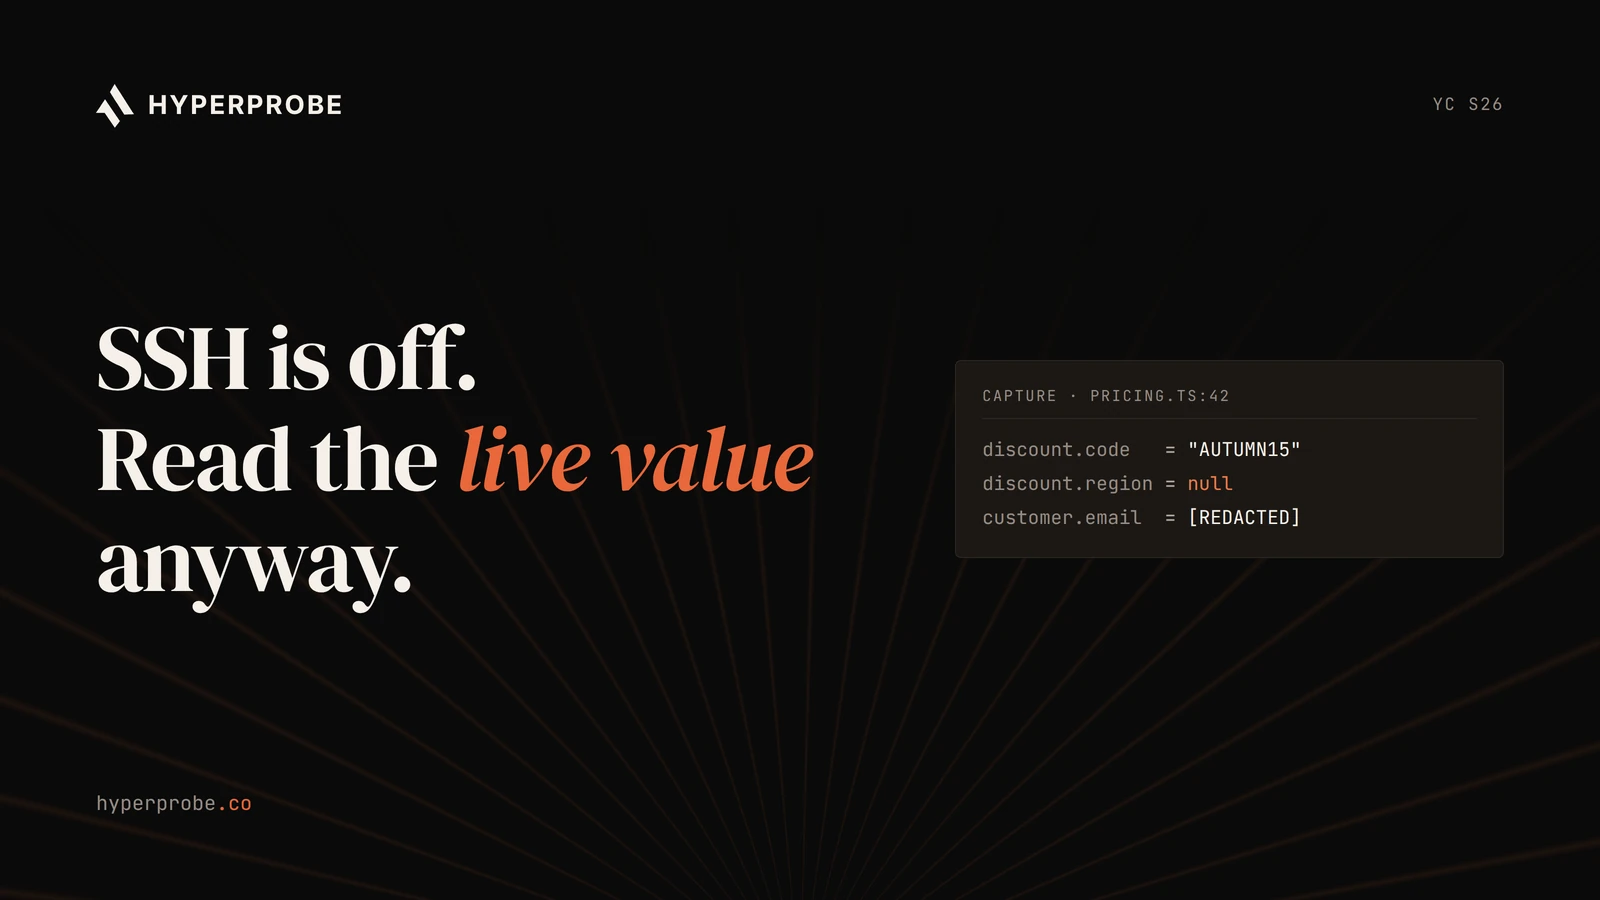
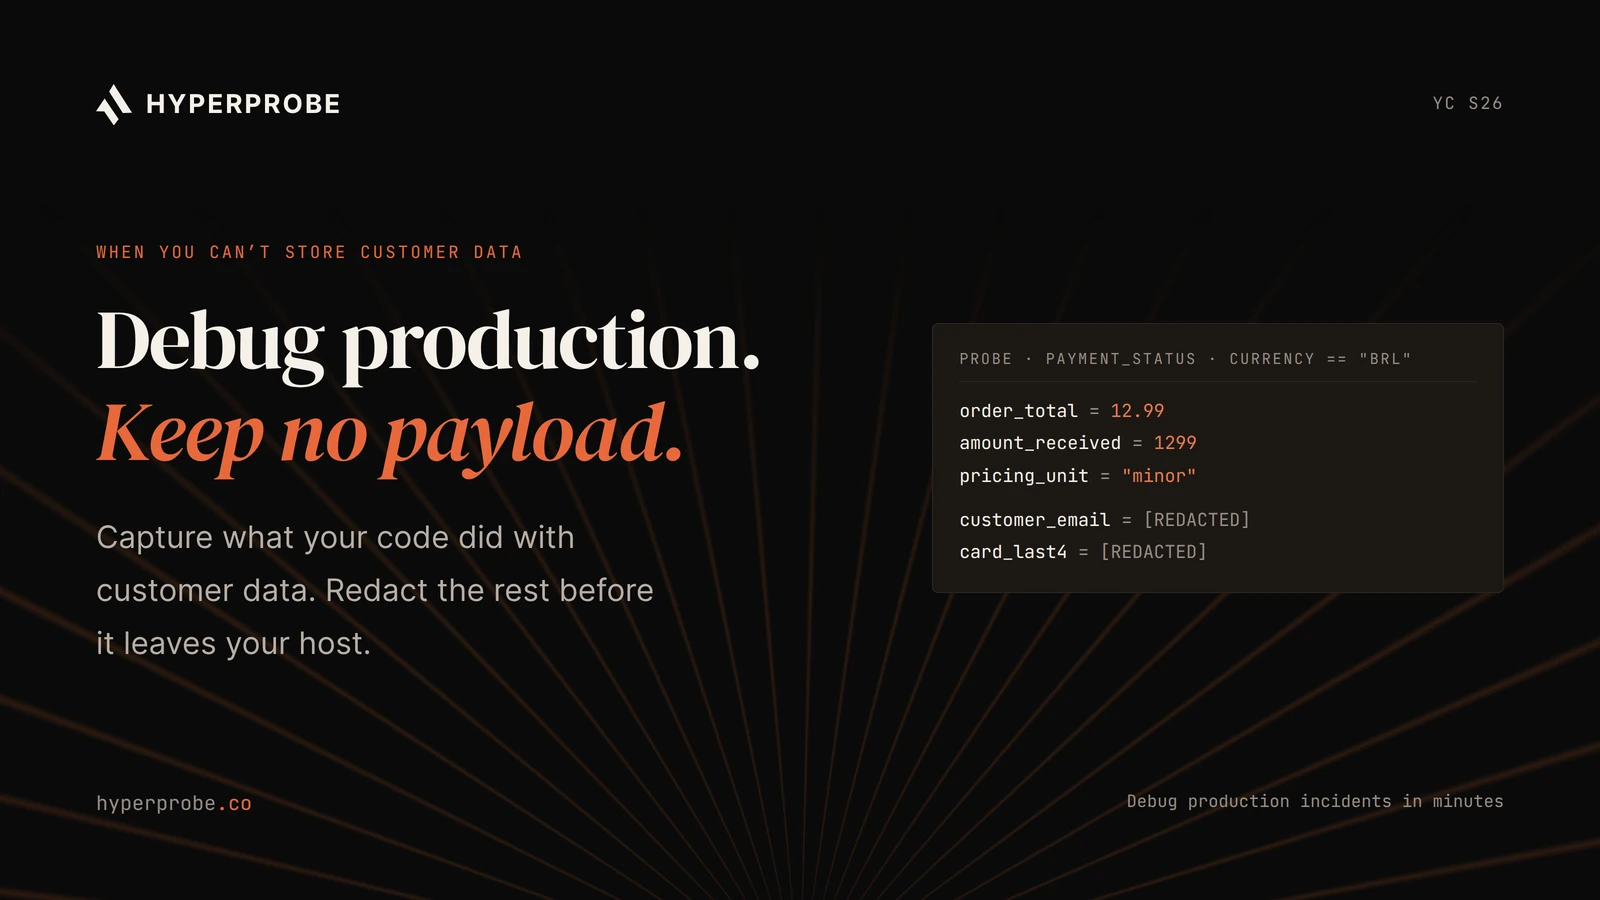
Back to the order. You place a probe on the line that sets payment_status, with the condition order.currency == "BRL". The next affected request hits it and you get a capture: order_total = 12.99, amount_received = 1299, pricing_unit = "minor", customer_email = [REDACTED]. Tuesday's deploy switched the pricing service to minor units for one currency, and the handler never divided. You have confirmed the root cause from captured evidence, and nothing in the capture identifies the customer. The probe clears itself after its hit limit. Our guide on capturing a variable that was never logged compares this with the other ways to get the same value.
Where HyperProbe fits
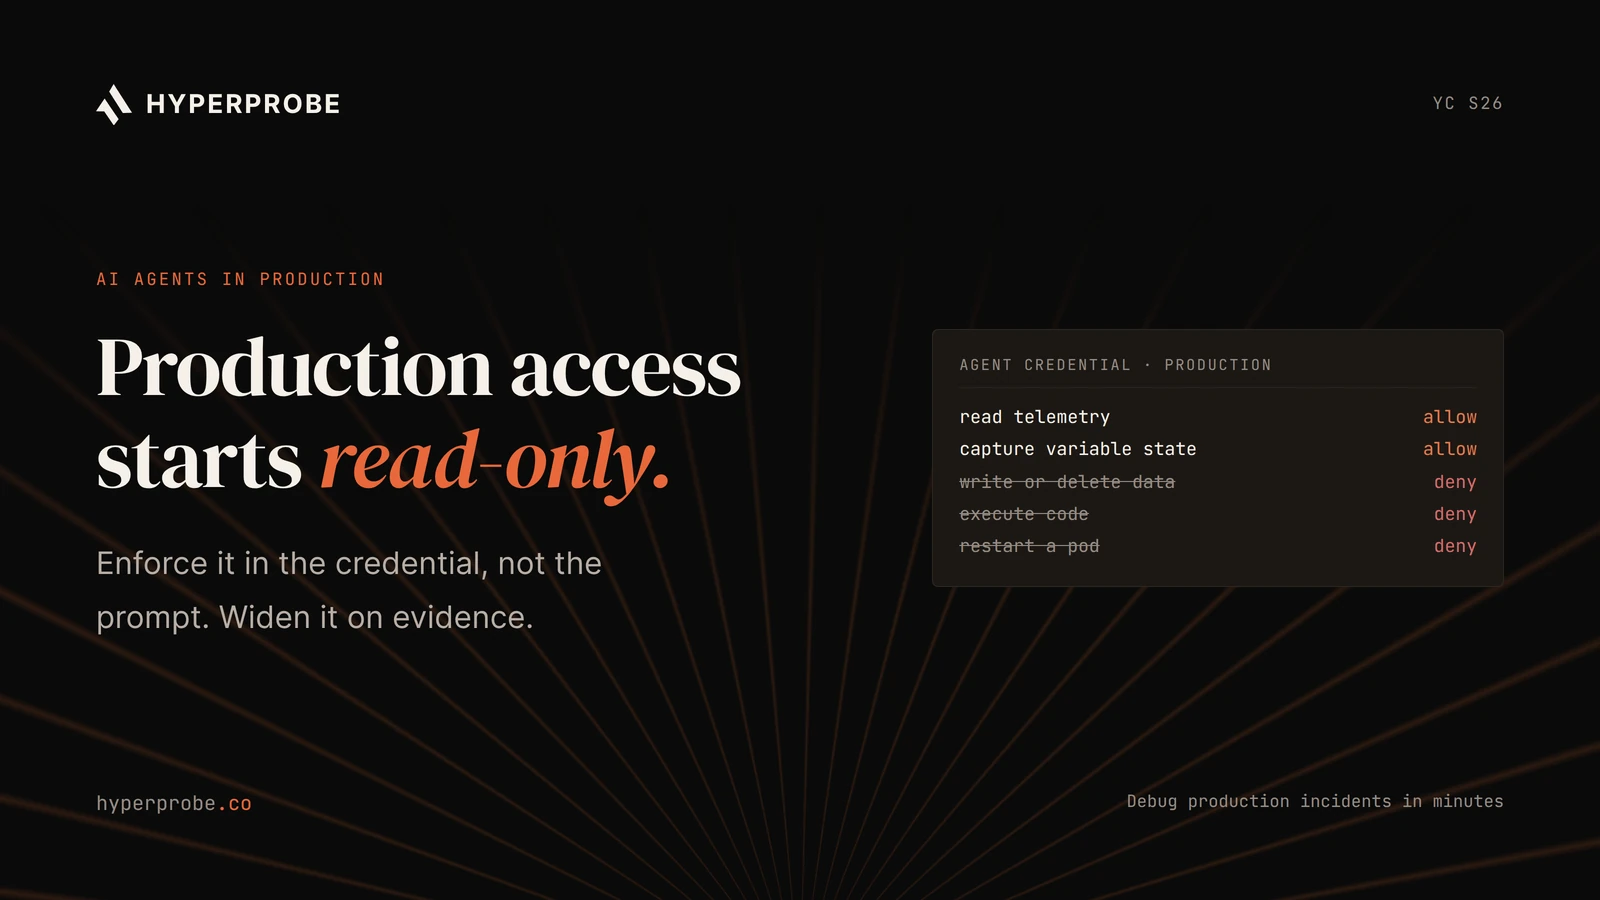
Our AI on-call agent is built on this rung. Probes are read-only, so the agent captures state but cannot write memory or execute code. PII is redacted at the agent before a captured value leaves your service. Every probe is bounded by a time to live, a rate limit and a hit expiry, so nothing lingers after the investigation. Each placement and capture is recorded in an immutable audit trail, and probes can stay approval-gated until your team trusts the agent. If you have residency requirements, you can run it self-hosted or inside a private VPC.
The agent sits alongside your existing logs, traces and APM. Our comparison of production debugging tools by what each can see covers where each one belongs.
One limit applies to any probe, ours included. A probe only sees executions after it is placed. An incident that already ended has to be worked from the telemetry you already had, and the probe helps you catch the next occurrence.
Guardrails security will sign off on
Engineering leaders approving any of these techniques should check the same short list, whether the tool comes from a vendor or from your platform team.
- Redaction before the data leaves the host, with no debug path that skips it.
- A scope and an expiry set when the diagnostic is enabled, with the rollback written first.
- Read-only, time-limited access. The hoop.dev guide describes this as short-lived tokens, revocable sessions and an audit of every debug action.
- Approved storage for captured evidence, with a deletion date attached when it is created. Raw payloads never get pasted into a ticket or an incident channel.
- Locked logging configuration. AWS recommends that only administrators can change it, with log integrity validation turned on so nobody can widen the net unnoticed.
Ask those questions of any tool before it touches production, including the ones your own team built.
Start with your next wrong-value bug
Working without stored customer data changes how you investigate, but it doesn't have to make the investigation longer. Each rung keeps the payload where it belongs and still moves diagnosis forward, which is the part of MTTR that usually takes the longest. Our guide on reducing MTTR on a backend service covers the rest of that clock.
The next time a value comes out wrong, start at the bottom rung and climb only as far as you need. To try the top rung on your own service, install the HyperProbe SDK on one service with redaction on by default. The first real incident we work through with you is free.
Debug production in minutes. Book a demo.
Frequently asked questions
Can I log customer email addresses for debugging?
Treat them as personal data. OWASP's logging guidance lists names, emails and phone numbers as fields to mask or pseudonymise before they are written anywhere, so log a keyed hash of the address for correlation and keep the raw value out of logs, tickets and chat.
Is hashing a customer ID enough to satisfy GDPR?
A keyed hash (HMAC with a secret held outside the log system) is pseudonymisation, which GDPR treats as a safeguard rather than full anonymisation. It is a strong improvement for correlation in logs, but the hashed records are still personal data if the key can link them back, so keep them under the same retention limits.
Does dynamic instrumentation store customer data?
It depends on where redaction runs. Well-built probes redact by identifier name, type and value pattern inside the process, so sensitive values never leave the host. HyperProbe redacts PII at the agent before capture, and every probe expires through its time to live, rate limit and hit expiry.
What should I do when the bug only happens for one customer?
Scope your diagnostics to that customer's hashed reference. Enable a targeted debug flag with a 30-minute expiry and an event budget, ask support to have them retry, collect structured derived facts, and let the flag expire. If you need the actual variable value, place a conditional read-only probe on the suspect line instead.
How do I debug an incident that already ended without stored payloads?
Work from the telemetry you already collect under an approved regime: error rates, traces, histograms and grouped counts over the affected window. Probes and scoped debug flags only see executions after they are enabled, so for one-off incidents they help you catch the next occurrence rather than reconstruct the last one.
Written by
Founder
Shailendra Singh is the founder and CEO of HyperProbe (YC S26), an AI on-call agent that debugs production incidents by capturing evidence directly from running services. He has over a decade of experience building and running production systems, starting at Applied Materials before moving into startup operating and engineering leadership roles, including at a company that later became a unicorn. He founded and ran Transporter.city from 2017 to 2021, then spent three years building HyperTest before founding HyperProbe with Karan Raina. He writes about production debugging and incident response.
RELATED READS