Quick Overview:
You can debug production without SSH by working up four read-only channels. They are existing telemetry, a brokered session that records itself, a Kubernetes ephemeral container, and a read-only probe that captures live variable state. Each one leaves a record and none can change the system underneath you, which SSH never guaranteed. This guide follows one checkout incident through all four and ends with the policy checklist managers need to approve them.
A checkout service starts returning 500s for one customer segment at 11 p.m. The on-call engineer types the hostname out of habit and gets nothing back. SSH to production was switched off last quarter, and the ticket that announced it did not say what to do instead.
The answer is a ladder of read-only channels. Start with the telemetry you already collect, and move to a brokered session when you truly need a shell. Attach a temporary container when the image has no shell, and capture live variable state when none of those shows the value you need. Every rung leaves a record and none of them can change the system underneath you.
Why SSH to production went away
SSH could not be audited, and it could change the host. AWS's Well-Architected guidance lists interactive troubleshooting on an instance as an anti-pattern and recommends closing port 22 in favour of a session tool that logs activity. The immutable infrastructure argument is simpler: once someone can open a shell on a box, the server that was tested is no longer the server that is running.
Regulators push the same way. In India, the RBI's Master Direction on IT governance has applied to banks and NBFCs since April 2024. It ties access to production systems to least privilege, so engineers at regulated lenders often have no shell to fall back on.
The need for evidence survived the policy change. The rungs below get you that evidence through channels that leave a trail.
The four rungs at a glance
| Rung |
What it shows in the checkout incident |
What it still misses |
| Existing telemetry |
The failing route, tenant, time window and discount code |
Any value nobody logged in advance |
| Brokered session |
The host: files, config, processes |
Nothing inside a pod built from a distroless image |
| Ephemeral container |
The process from outside: sockets, env, memory pressure |
Variable values inside a live request |
| Read-only probe |
Local variables at one line on the next failing request |
Executions from before the probe was placed |
Rung one: narrow the telemetry you already have
The incident produced data before anyone touched a terminal. What makes it useful is narrowness: a tight window around the first failure, filtered by route and status, with a failing request compared against a good one in the trace view.
fields @timestamp, requestId, tenantId, route, status, msg
| filter route = "/checkout" and status >= 500
| filter @timestamp > "2026-10-27T23:00:00Z" and @timestamp < "2026-10-27T23:10:00Z"
| sort @timestamp asc
| limit 50
Two habits widen this rung. Log the effective configuration at startup, so a bad environment variable shows up without a login. And log the inputs on the handlers that matter, not only the outputs.
The limit is that telemetry only shows what someone chose to record. The log line shows the discount code on the failing orders. It does not show the discount object the pricing branch built from that code, and that is the value the engineer needs.
Rung two: a brokered session that records itself
When a shell is the only answer, get it through a broker instead of reopening port 22. AWS Systems Manager's just-in-time node access asks the engineer for a reason, auto-approves or routes the request to a person, caps the session length and keeps the record for a year.
The ask to security is specific: a just-in-time policy scoped to the on-call rotation, auto-approved while an incident is declared and manually approved otherwise. The recording is what makes the request easy to approve, because the reviewer can replay the session instead of trusting a summary.
A recorded shell is still a shell on a host that can change. And the checkout service runs in a pod built from a distroless image, so there is no shell to land in.
Rung three: an ephemeral container in the pod
Distroless images ship without a shell, so kubectl exec has nothing to run. Ephemeral containers solve this by attaching a temporary troubleshooting container to the running pod. They are never restarted and are not part of the pod's declared spec.
kubectl debug -it checkout-7d9f6b5c4-x2k8p \
  --image=busybox:1.36 \
  --target=checkout \
  -- sh
--target shares the process namespace with the application container, so ps and /proc see the real process. Give the right only to the on-call role, and the cluster audit log records every use:
apiVersion: rbac.authorization.k8s.io/v1
kind: Role
metadata:
  name: oncall-debug
  namespace: checkout
rules:
  - apiGroups: [""]
    resources: ["pods/ephemeralcontainers"]
    verbs: ["patch"]
  - apiGroups: [""]
    resources: ["pods"]
    verbs: ["get", "list"]
This rung shows the process from the outside. It cannot show the value of a variable inside a request that is mid-flight. The null breaking checkout lives in application memory, and ps will never print it.
Rung four: capture the value without a shell
Dynamic instrumentation closes the gap the other rungs leave. You mark a line of code, and the next time production runs it, the runtime records the local variables and carries on without pausing. Our guide on inspecting live variables without logs walks through the technique.
Back to checkout. The probe goes on the line where the pricing branch reads the discount. A condition makes it fire only for the failing tenant:
export function applyDiscount(order: Order, discount: Discount): number {
const rate = regionRates[discount.region];
return order.subtotal * (1 - rate);
}
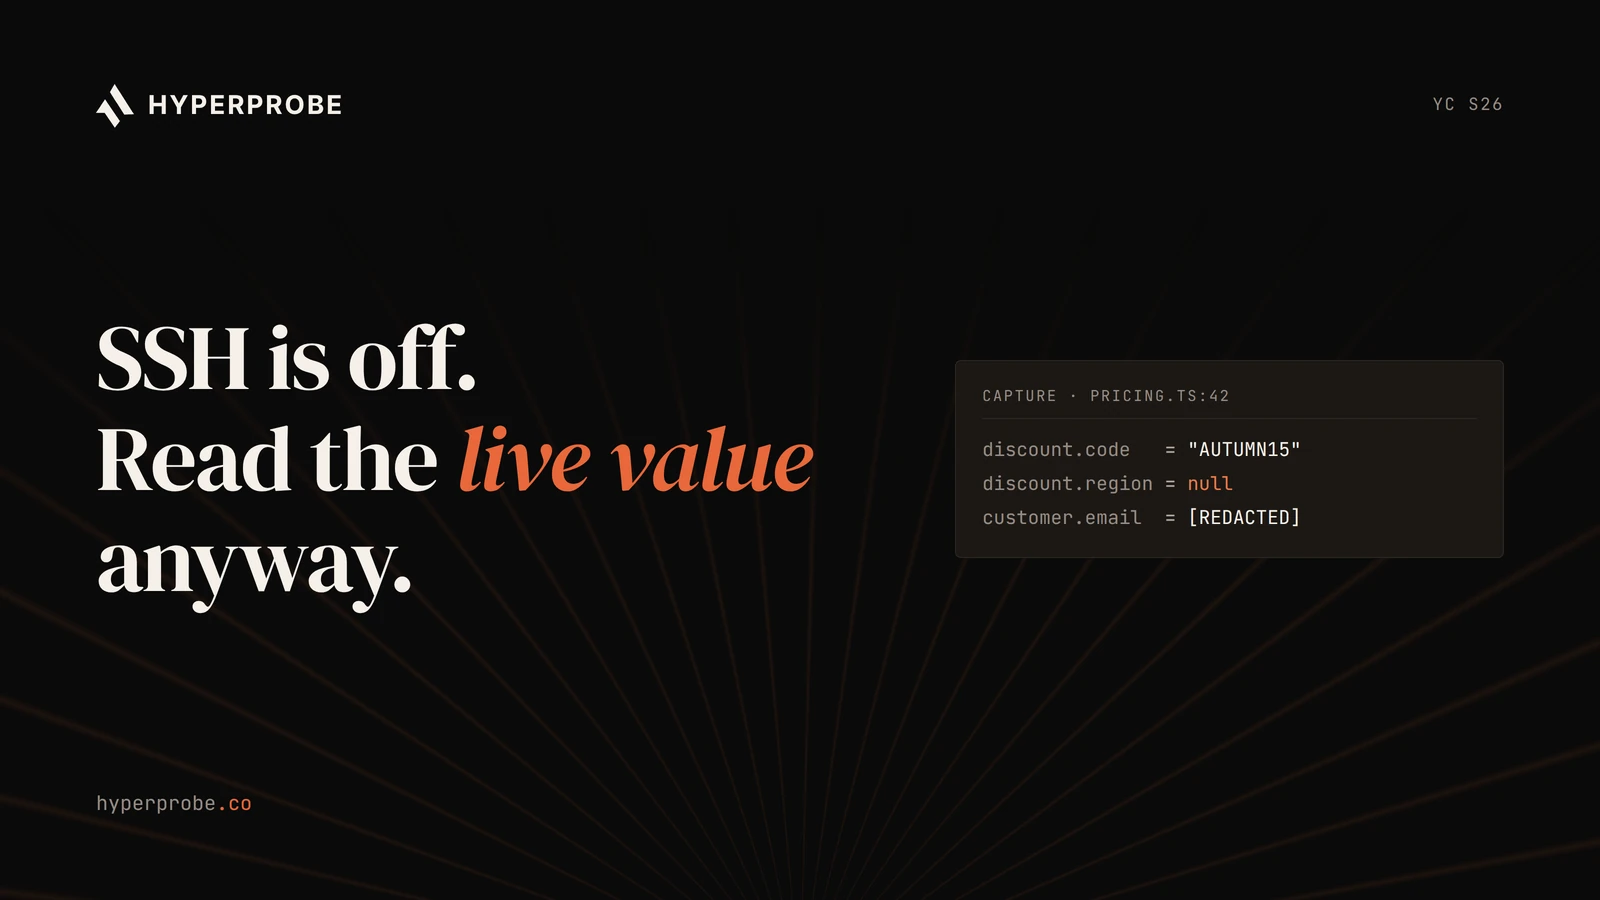
capture · pricing.ts:42 · checkout-7d9f6b5c4-x2k8p
discount.code     = "AUTUMN15"
discount.region   = null
order.tenantId    = "t_4471"
order.subtotal    = 84.00
customer.email    = [REDACTED]
The tenant migrated last week, and its discounts were copied over without a region. The engineer writes a two-line fix, ships it through the normal pipeline, and the next capture shows region populated. Nobody opened a shell.
[INSERT INFOGRAPHIC 1: hyperprobe-no-ssh-infographic-1-checkout-without-a-shell.webp]
Alt text: Debugging a checkout incident without SSH: logs narrow the failing tenant and time window, a trace points to the pricing branch, a read-only probe on the discount line captures region as null, and the fix ships through the normal pipeline.
Where HyperProbe fits
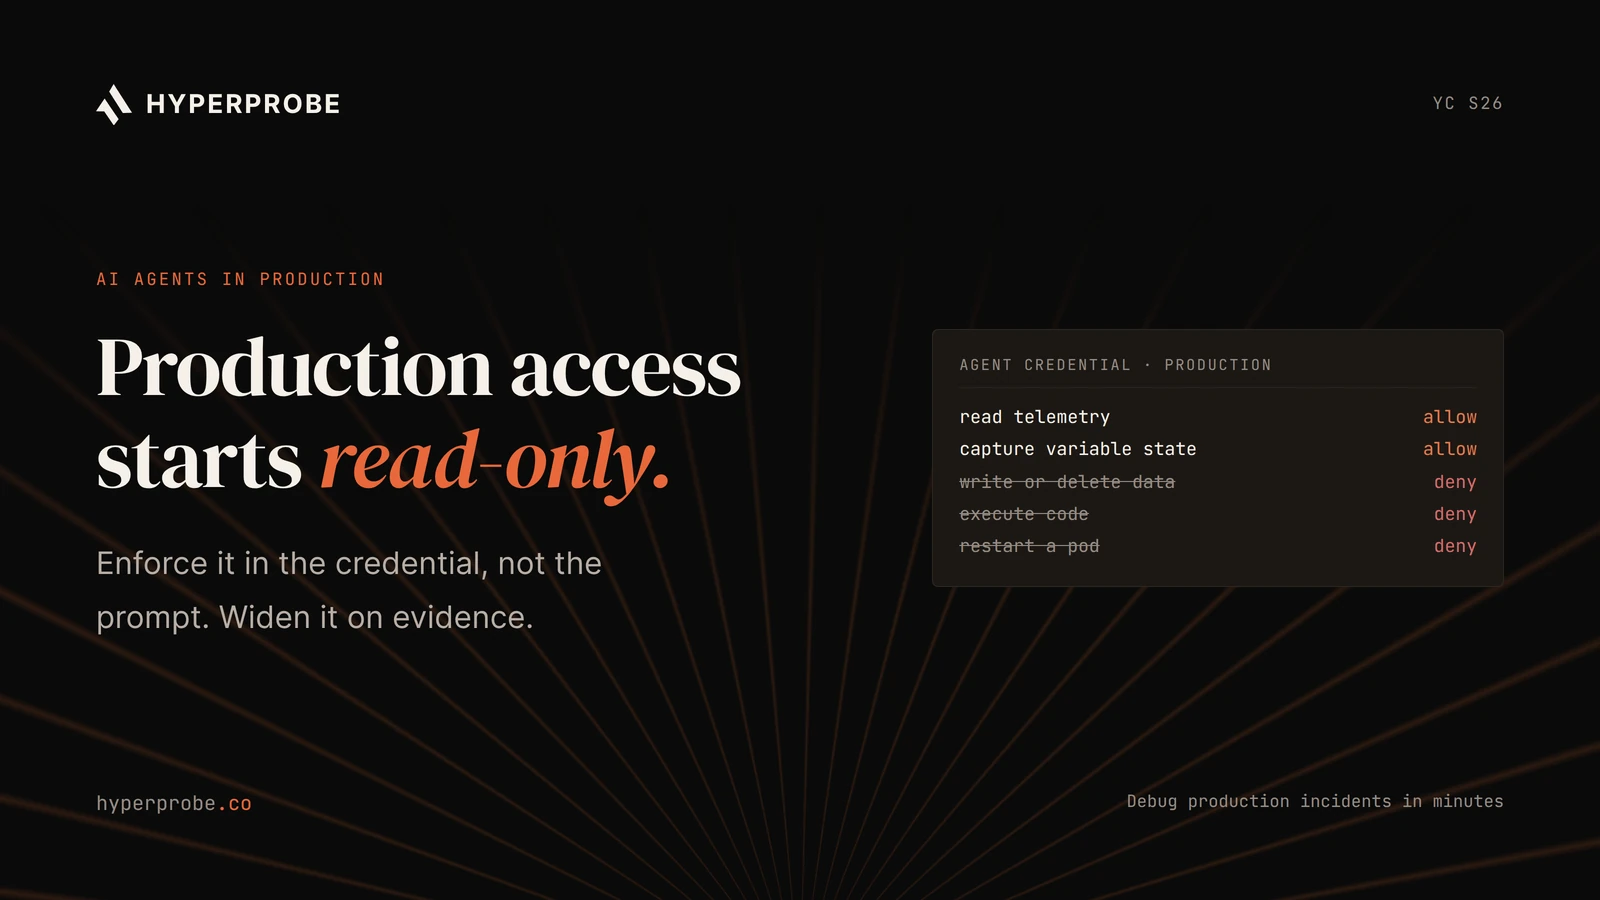
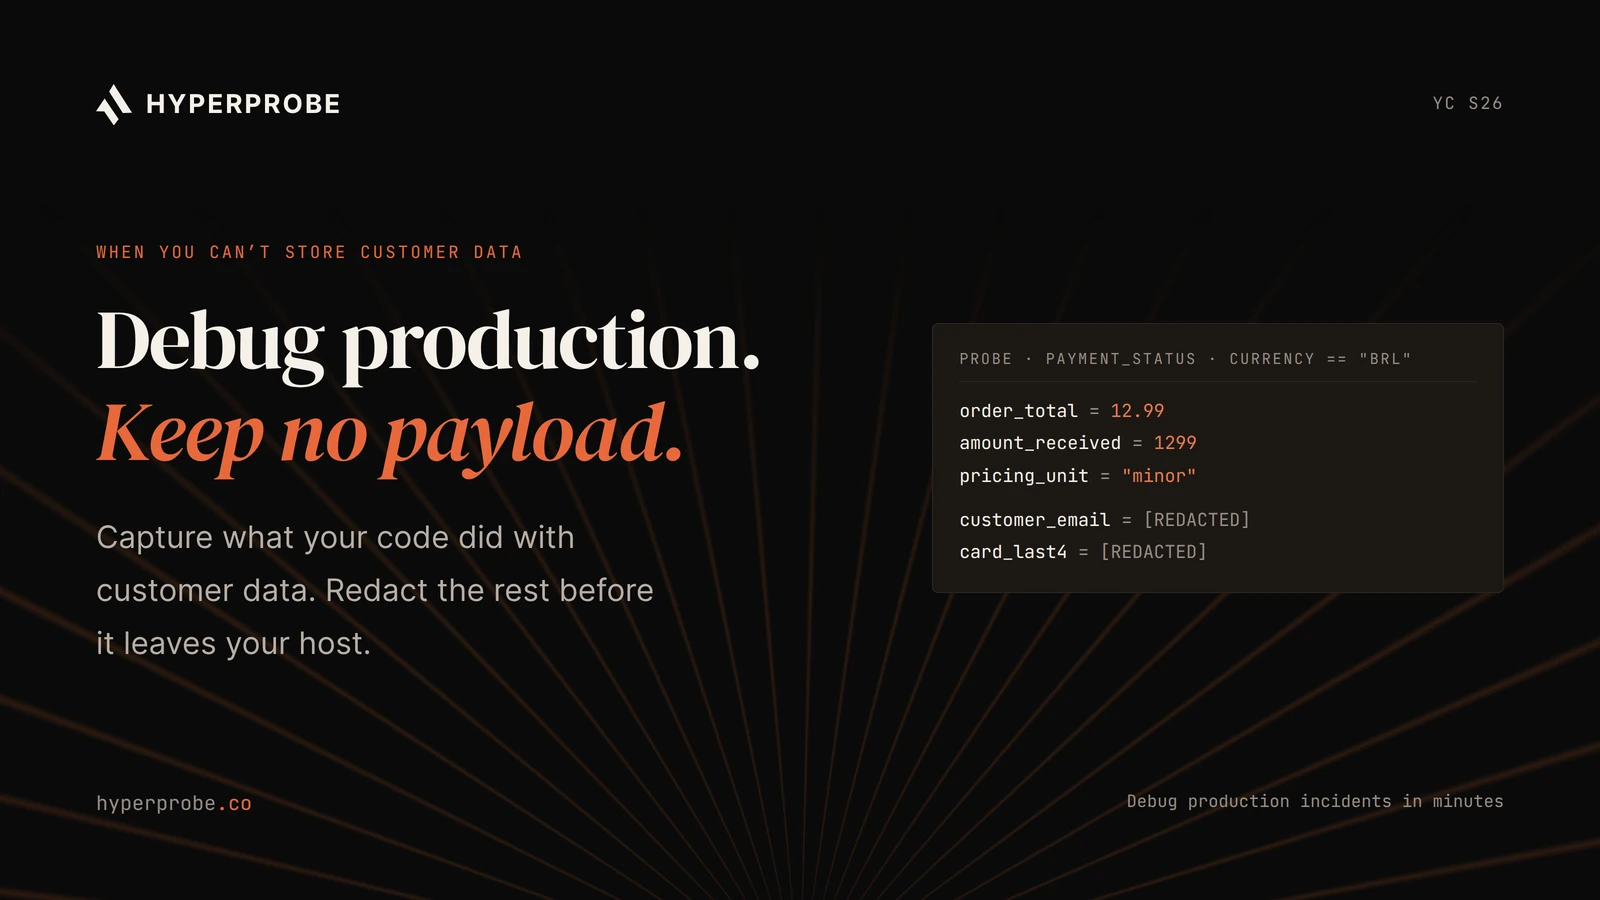
HyperProbe is an AI on-call agent built on this fourth rung. You or the agent place a probe from your coding agent, and our SDK applies it in-process. Probes are read-only, so they capture state but cannot write memory or execute code. Each probe is bounded by a time to live, a rate limit and a hit expiry, and clears itself when any one is reached. PII is redacted at the agent before a capture leaves your service, every placement and capture is recorded in an immutable audit trail, and probes can stay approval-gated until your team trusts the agent. Overhead stays under 1% at 3,000 requests per second. If policy keeps production data inside your network, you can run it self-hosted or in a private VPC.
The agent sits alongside your logs and traces. Our comparison of production debugging tools by what each can see shows where each layer fits. A probe has two limits: it only sees requests after it is placed, and it covers application code, not the network or infrastructure.
A policy checklist for engineering managers
Approving these channels comes down to five controls. Use them for any access path, whether it comes from a vendor or your platform team.
[INSERT INFOGRAPHIC 2: hyperprobe-no-ssh-infographic-2-access-channels-compared.webp]
Alt text: Production access channels compared on four controls. SSH can change production, is not recorded and does not expire. A brokered session is recorded and time-bound. An ephemeral container is audited and temporary. A read-only probe cannot change production, is audited, expires on its own and shows variable values.
- Read-only by default. Anything that can change the host is an exception tied to a declared incident.
- A record for every path. A session recording, a cluster audit entry or a probe audit log, showing who, what and when.
- A time bound on everything. Sessions, ephemeral containers and probes all expire, so nothing left at 2 a.m. becomes permanent.
- Redaction before data leaves the host.
- At least one rung that shows live values. That is the question SSH used to answer, and telemetry never will.
If your team is wiring coding agents into these channels, read our guide to MCP servers for production debugging first.
Production state is readable without a shell
Every rung on this ladder leaves a record, and the ones that open access also close it on their own. That is why security can approve them. This week, take your last incident that ended with someone asking for SSH, and write down which rung would have answered the question.
Then try the fourth rung. Install the HyperProbe SDK on one service with the free plan, which takes about 15 minutes to set up. The first real incident we work through with you is free.

 Shailendra SinghNov 1, 202610 min read