Best incident response tools 2026: an SRE guide to reducing MTTR


Quick answer:
The best incident response tools for reducing MTTR in 2026 are HyperProbe for code-level diagnosis, PagerDuty, incident.io and Rootly for mobilization, Datadog, Honeycomb and Sentry for diagnosis, LaunchDarkly and Argo Rollouts for mitigation, and Atlassian Statuspage for communication. Measure which phase took longest across your last 10 incidents, then buy for that phase first.
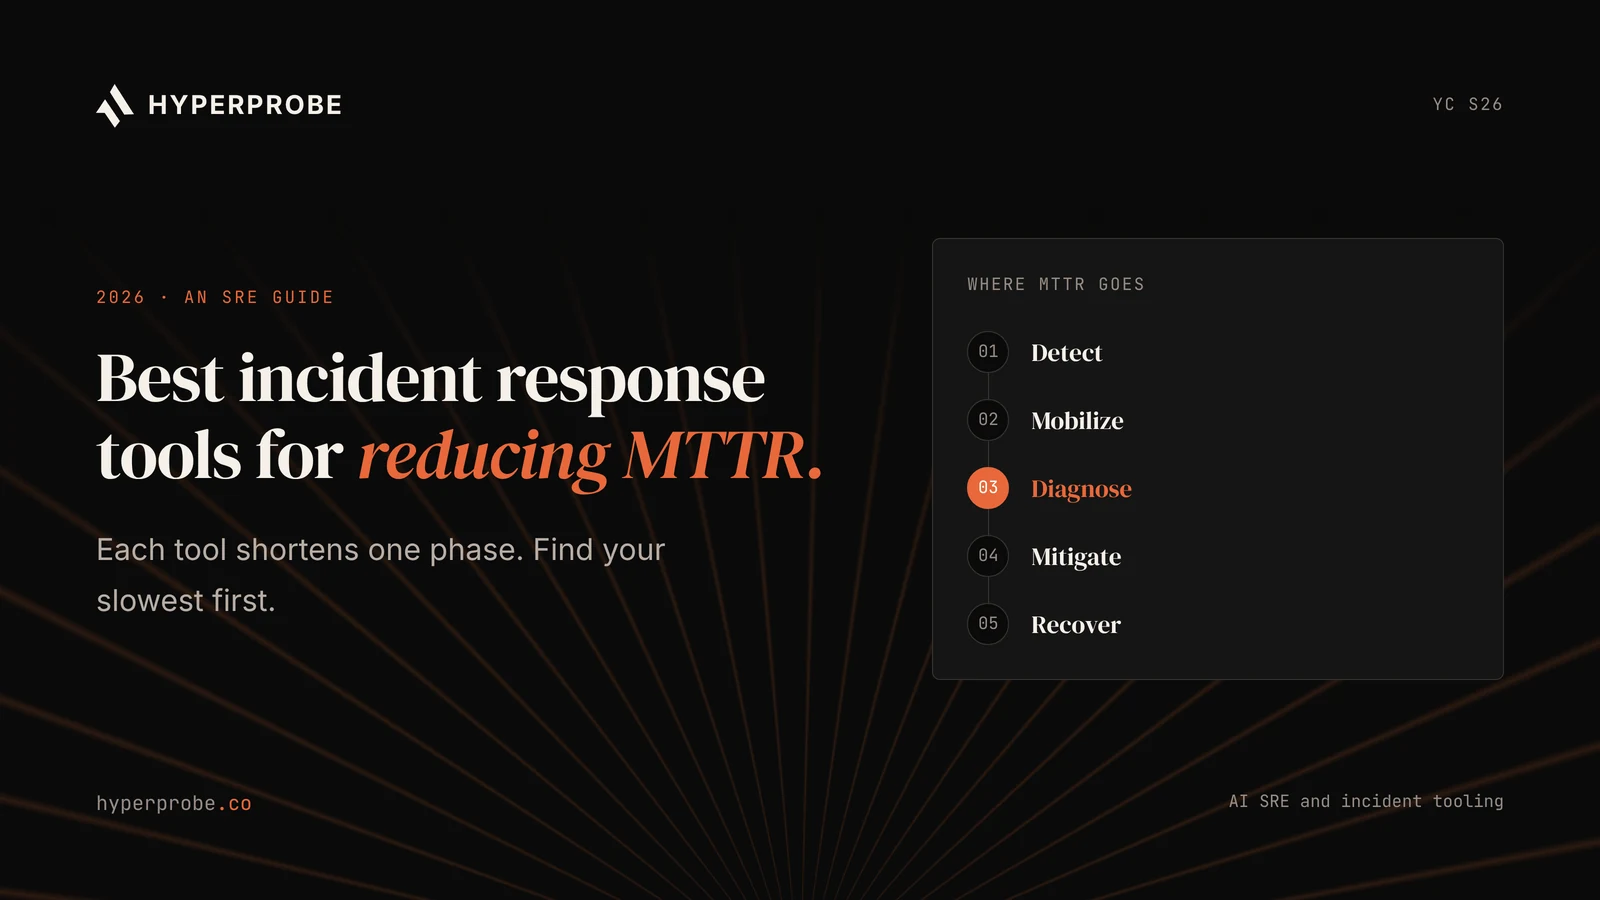
The best incident response tools in 2026 for reducing MTTR are HyperProbe, PagerDuty, incident.io, Rootly, Datadog, Honeycomb, Sentry, LaunchDarkly, Argo Rollouts and Atlassian Statuspage. Each one shortens a different phase of the incident clock. Mean time to resolution (MTTR) is the average time from the start of an incident to its resolution, and that time splits into detection, mobilization, diagnosis, mitigation and recovery.
Paging and coordination tools are mature, so the minutes they can still save are limited. Diagnosis is different. Diagnosis is the phase where the on-call engineer forms a hypothesis and checks it against telemetry, and its length depends on whether the evidence was ever collected. This guide maps each tool to the phase it shortens, so an SRE team can spend its budget on the slowest phase first.
Which incident response tools reduce MTTR?
Ten incident response tools lead in 2026 on adoption, depth in their phase and pricing clarity. The table below lists each tool, the MTTR phase it shortens, the entry list price and the team it suits.
| Tool | MTTR phase it shortens | Entry paid price (list) | Best for |
|---|---|---|---|
| HyperProbe | Diagnosis of live code-level causes | Per service, unlimited probes and captures on every tier | Incidents where logs and traces stop short of the cause |
| PagerDuty | Mobilization | $21 per user per month annual | Complex escalation and paging at scale |
| incident.io | Mobilization and coordination | $15 per user per month annual, on-call extra | Response run inside Slack or Microsoft Teams |
| Rootly | Coordination and workflow automation | $20 per user per month, on-call extra | Teams that automate response steps |
| Datadog | Detection and diagnosis | $15 per host Infrastructure Pro plus $31 per host APM, annual | Teams with telemetry already in Datadog |
| Honeycomb | Diagnosis | $150 per month for 50 million events | High-cardinality questions during an incident |
| Sentry | Diagnosis of code errors | $26 per month Team plan, annual | Application errors tied to a release and commit |
| LaunchDarkly | Mitigation | $10 per service connection per month, annual | Turning off a faulty feature without a deploy |
| Argo Rollouts | Mitigation | Free, open source | Automated canary rollback on Kubernetes |
| Atlassian Statuspage | Stakeholder communication | $29 per month Hobby plan | Public status updates during an incident |
Prices are list prices from vendor pricing pages and public pricing trackers in November 2026. Negotiated contracts differ, and AI features on several of these tools carry a separate meter.
Where does MTTR time go?
MTTR time goes into five phases, and each phase has its own tools and its own failure mode. The list below defines each phase by where it starts and ends.
- Detection. From the moment a fault starts to the first alert. Monitoring and alert rules set this phase.
- Mobilization. From the first alert to the right engineer working on the problem. Paging, routing and escalation set this phase.
- Diagnosis. From the first look to a confirmed cause or a confident mitigation. Telemetry, error tracking and code-level evidence set this phase.
- Mitigation. From the decision to act to the end of user impact. Rollbacks, feature flags and traffic controls set this phase.
- Recovery and learning. From the end of user impact to a verified fix and a written postmortem.
The order of work inside an incident matters for tool choice. Google's SRE book on effective troubleshooting tells responders to stop the bleeding before they search for the root cause, while preserving evidence such as logs for the later analysis. A mitigation tool can end user impact before anyone knows the cause. A diagnosis tool decides whether the same incident returns next week.
The name of the metric also changed. DORA renamed its MTTR metric to failed deployment recovery time in 2023, and the new metric counts only failures caused by a deployment. A cloud provider outage still counts toward incident MTTR but not toward the DORA metric. HyperProbe's guide to which MTTR version a team should track sets out the definitions side by side.
A single MTTR number hides which phase is slow. The breakdown of MTTD vs MTTR shows why detection time and resolution time need separate clocks, especially for failures that never raise an error.
How were these tools selected?
These tools were selected on six criteria that decide whether a tool removes minutes from a real incident or adds another screen to check. The list below states each criterion.
- Phase shortened. Which part of the incident clock the tool changes, and how the change shows up in incident timestamps.
- Evidence used. Which data the tool reads: alerts, metrics, traces, logs, errors, deploys or code.
- Actions allowed. Whether the tool only shows information, or can also page, roll back or switch off a feature.
- Approval and audit. Whether actions need human approval, and whether each step is logged for the postmortem.
- Deployment model. SaaS only, regional hosting or a self-managed option.
- Pricing clarity. Whether the price and the billing unit are published, or sales-led.
Each tool below follows the same structure: best for, what it does, strengths, limits and public pricing. HyperProbe comes first because it covers the gap the other tools leave: code-level evidence that was never logged. The sections after it follow the order of the incident clock rather than a single ranking for every team.
Which tool captures the evidence that logs missed?
1. HyperProbe
Best for: SRE and backend teams whose incidents stall after the first hypothesis because the logs and traces never recorded the value that matters.
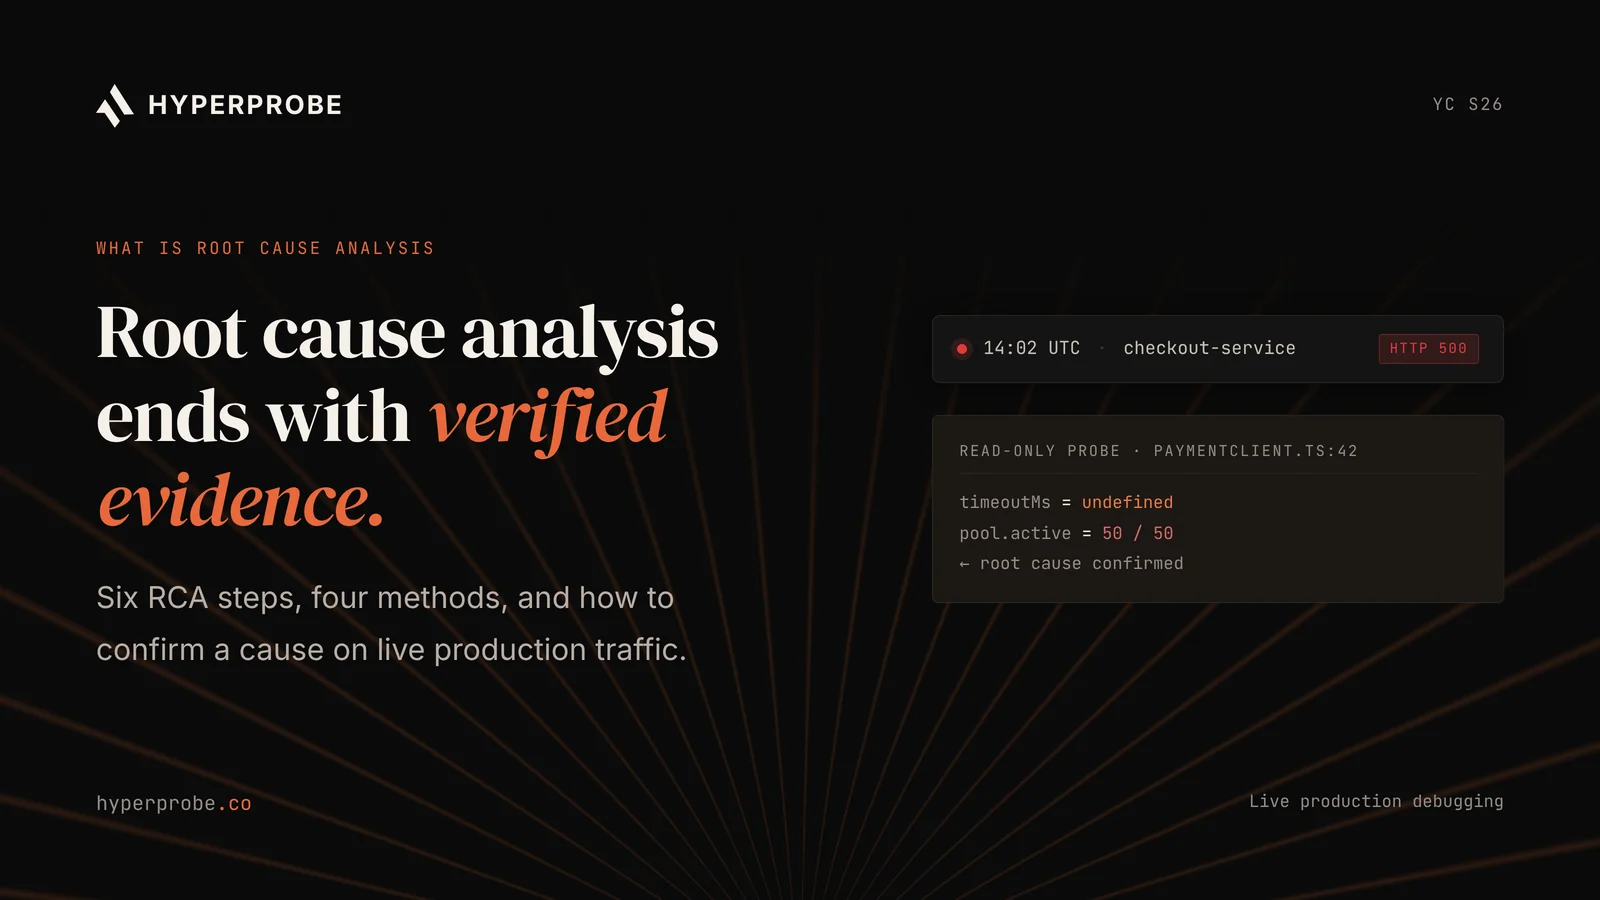
What it does: HyperProbe is an AI on-call agent for live production debugging, built on dynamic instrumentation. Dynamic instrumentation means adding a capture point to running code without changing the source or redeploying. During an incident, HyperProbe places a read-only probe on the suspect line and captures variable state the next time that line runs, so the engineer confirms the root cause from captured evidence instead of guessing. The guide to inspecting a live production variable without adding a log line shows the workflow.
Strengths: Read-only probes do not pause production, change source code or require a redeploy. PII is redacted at the agent before capture, and probes self-clear on a time limit and rate limit. Commit SHA alignment is enforced before a probe attaches. Private VPC and self-hosted deployments are available for enterprise teams.
Limits: HyperProbe works in the diagnosis phase. It does not page, run incident channels, roll back releases or replace monitoring, so it sits beside the tools below rather than instead of them.
Public pricing: Pricing is per service, with unlimited probes and captures on every tier, so cost does not grow with incident count.
Try it: Install the SDK and place your first probe with the HyperProbe quickstart, or book a walkthrough to run it against one of your own past incidents.
Which tools shorten mobilization?
Mobilization tools shorten the time between the first alert and an engineer who owns the problem. PagerDuty, incident.io and Rootly lead this phase, and each one now adds AI on top of paging and coordination.
2. PagerDuty
Best for: Large organizations with many services, complex escalation policies and an existing automation practice.
What it does: PagerDuty routes events from monitoring tools, pages responders through schedules and escalation policies, and runs incident workflows. On November 3, 2026, PagerDuty introduced Paige, an AI agent that joins an escalation policy and investigates alerts before a human responder picks them up.
Strengths: More than 700 integrations cover nearly every monitoring source a team runs. Escalation rules, overrides and schedules handle large rotations across time zones. Paige permissions are set team by team, which gives a security reviewer an approval boundary to inspect.
Limits: AIOps noise reduction and status pages below Enterprise are separate add-ons, so the seat price is a floor. Paige is new as of this writing, and production references are limited. PagerDuty shortens mobilization well, but its diagnosis features depend on the evidence other tools send it.
Public pricing: PagerDuty is free for up to 5 users. Professional is $21 per user per month on annual billing, and Business is $41 per user per month on annual billing. AIOps, Enterprise and AI agent pricing are sales-led.
3. incident.io
Best for: Engineering teams that declare and run incidents in Slack or Microsoft Teams and want paging in the same tool.
What it does: incident.io covers on-call, incident channels, roles, timelines, status pages and postmortems. Its Investigations feature, generally available since August 5, 2026, posts a first summary when an incident opens and updates it as new evidence arrives.
Strengths: The alert, the channel, the roles and the timeline live in one product, so responders do not copy context between tools. Investigations lists the sources it read and the theories it rejected, so an engineer can check the reasoning. Seat prices are published.
Limits: On-call is a separate per-user add-on, so the full seat price is higher than the headline. The AI reasons over data that connected tools already hold.
Public pricing: incident.io has a free Basic plan. Team is $15 per user per month on annual billing, plus $10 per user for on-call. Pro is $25 per user per month, plus $20 per user for on-call. Enterprise is sales-led.
4. Rootly
Best for: Teams that want chat-native response with heavy workflow automation.
What it does: Rootly runs incidents in Slack or Microsoft Teams with configurable workflows that open channels, assign roles, page responders, create tickets and update status pages. Rootly's AI SRE product correlates telemetry, recent deploys and past incidents into a root-cause hypothesis with linked evidence.
Strengths: The workflow engine removes repeated manual steps, such as creating a Jira ticket or inviting a service owner, from every incident. Rootly states that its AI SRE returns an inconclusive result when the evidence does not support a cause.
Limits: Incident Response and On-Call are separate per-user licenses, so an engineer who carries the pager and runs incidents needs both. In October 2026, Rootly changed its packaging so that AI SRE requires the Incident Response product. AI SRE pricing is not public.
Public pricing: Incident Response is $20 per user per month. On-Call is $20 per user per month on top. AI SRE and Enterprise are sales-led.
Which tools shorten diagnosis?
Diagnosis tools shorten the time between "something is wrong" and "this is why". Datadog, Honeycomb and Sentry lead this phase with different evidence: infrastructure and traces, high-cardinality events, and application errors tied to code.
5. Datadog
Best for: Teams whose metrics, logs and traces already live in Datadog.
What it does: Datadog collects infrastructure metrics, application traces and logs, and fires monitors on them. Bits AI SRE, which Datadog now calls Bits Investigation, starts an investigation when a monitor alerts and reads traces, logs, dashboards, change events and past incidents. Datadog's documentation states that each hypothesis ends as validated, invalidated or inconclusive.
Strengths: Detection and diagnosis share one data store, so a responder moves from a monitor to the related trace without an integration hop. The explicit inconclusive state gives an SRE a way to see when the AI lacks evidence, rather than a confident guess.
Limits: The AI sees only what Datadog ingested. Services or signals outside Datadog are invisible to it. Every APM host also needs an infrastructure license, and AI usage draws from a separate credit pool, so the bill has several meters.
Public pricing: Datadog lists Infrastructure Pro at $15 per host per month and APM at $31 per host per month on annual billing, with APM requiring an infrastructure license on the same host. Logs, AI credits and incident products are billed separately.
6. Honeycomb
Best for: Teams that need to ask new questions of production data during an incident, such as which customer, region or build version is failing.
What it does: Honeycomb stores spans and structured events with many fields each, and lets an engineer group and filter on any field at query time. BubbleUp compares a slow or failing group of requests with the healthy baseline and shows which fields differ.
Strengths: High-cardinality fields, such as a user ID or a tenant ID, stay queryable without pre-built dashboards. That property matters when the failure affects one customer out of thousands. Honeycomb's 2026 Pro plan includes time series metrics and Honeycomb Intelligence features such as Canvas and the Honeycomb MCP server.
Limits: Honeycomb answers questions about fields that the code already emits. A value that was never added to a span stays invisible. The event-based bill grows with traffic and span count, so sampling decisions affect both cost and evidence.
Public pricing: Honeycomb is free for up to 20 million events per month. Pro starts at $150 per month for 50 million events, at $3 per million events, up to 750 million events per month. Enterprise is sales-led.
7. Sentry
Best for: Teams whose incidents start as application exceptions that need to be tied to a release, a commit and a line of code.
What it does: Sentry groups exceptions into issues with stack traces, breadcrumbs, release and commit data. Seer, Sentry's AI debugging agent, uses that context plus traces, logs and the connected repository to propose a root cause and a fix.
Strengths: The stack trace points at a file and line, and release tracking shows which deploy introduced the error. That link between error and commit shortens the step from "errors went up" to "this change caused it".
Limits: Sentry sees exceptions and the context captured with them. Failures that return a successful response with wrong data raise no exception and never reach Sentry. Seer billing is changing: Sentry's documentation states that Seer moves from active-contributor pricing to usage-based credits on December 8, 2026.
Public pricing: Sentry has a free Developer plan for one user. Team is $26 per month and Business is $80 per month on annual billing, each with 50,000 errors included. Seer is currently $40 per active contributor per month, where an active contributor is anyone who opens two or more pull requests in a connected repository.
Which tools shorten mitigation?
Mitigation tools end user impact before the root cause is known. LaunchDarkly and Argo Rollouts lead this phase by removing the need for a full redeploy to undo a change.
8. LaunchDarkly
Best for: Teams that ship new behavior behind feature flags and want a kill switch for each change.
What it does: LaunchDarkly evaluates feature flags inside the application through its SDKs. A responder turns off the flag that guards a faulty feature, and the change takes effect without a build or a deploy.
Strengths: A flag change is faster and narrower than a rollback, because it removes one feature and keeps the rest of the release. LaunchDarkly keeps an audit log of flag changes, which feeds the incident timeline.
Limits: A flag only helps when the faulty code path sits behind one. Old flags left in the code add test paths and confusion during an incident, so flag cleanup is part of the cost. LaunchDarkly does not diagnose why the feature failed.
Public pricing: LaunchDarkly has a free Developer plan. Foundation is $10 per service connection per month plus $8.33 per 1,000 client-side monthly active users on annual billing, or $12 and $10 billed monthly. A service connection is one server-side SDK connected to one environment for a month. Enterprise is sales-led.
9. Argo Rollouts
Best for: Kubernetes teams that want a bad release to roll itself back before an engineer is paged.
What it does: Argo Rollouts is a Kubernetes controller that replaces the standard Deployment with canary and blue-green strategies. During a canary, it runs analysis queries against Prometheus, Datadog or another metrics source, then promotes the release or rolls it back automatically.
Strengths: Automated rollback removes detection, mobilization and the mitigation decision for one class of incident: a release that breaks a health metric. The project is open source under the Apache 2.0 license and is part of the Argo project, which is a graduated project of the Cloud Native Computing Foundation.
Limits: Argo Rollouts runs only on Kubernetes. It catches failures that the analysis metrics measure, so a fault that leaves error rate and latency unchanged passes the canary. A team runs and upgrades the controller itself.
Public pricing: Free and open source under the Apache 2.0 license.
Which tool handles status communication?
Atlassian Statuspage handles status communication to customers and internal teams. Stakeholder updates do not shorten the technical fix, but they remove interruptions from the people doing it.
10. Atlassian Statuspage
Best for: Teams that need a public or private status page with subscriber notifications during incidents.
What it does: Statuspage publishes component status and incident updates, and notifies subscribers by email, SMS or webhook. Incident tools can update it through integrations or the Statuspage API during response.
Strengths: Customers and internal teams read the status page instead of asking the incident channel for updates. A dedicated communications role can post from templates while engineers keep working.
Limits: Paid tiers scale by subscriber count, so a growing customer base moves the bill up in steps. Statuspage does not monitor services by itself, so status reflects what a person or an integration reports.
Public pricing: Statuspage has a free plan. Public page plans are Hobby at $29 per month, Startup at $99, Business at $399 and Enterprise at $1,499, by subscriber tier.
Which phase should you fix first?
Fix the phase that took the longest across your last 10 incidents. A phase-level baseline turns a tool purchase into a measurable change rather than a feature comparison. The table below lists where each phase starts and ends, and where the timestamp usually lives.
| Phase | Start timestamp | End timestamp | Where to find it |
|---|---|---|---|
| Detection | Fault start, from the first bad metric or deploy time | First alert fired | Monitoring tool and deploy log |
| Mobilization | First alert fired | Alert acknowledged by the owning engineer | Paging tool |
| Diagnosis | Acknowledgement | Mitigation chosen or cause confirmed | Incident timeline and chat |
| Mitigation | Mitigation chosen | User impact ends | Deploy log, flag audit log, metrics |
| Recovery | User impact ends | Fix verified and incident closed | Incident tool and postmortem |
Each long phase points to a different purchase. A long mobilization phase points to routing rules, escalation policies and on-call coverage, which PagerDuty, incident.io and Rootly address. A long mitigation phase points to the absence of a fast undo, which feature flags and automated rollback address. A long diagnosis phase points to missing evidence, and no paging tool shortens it.
The HyperProbe analysis of where backend teams lose hours in a production incident walks through the diagnosis loop step by step. HyperProbe's guide to reducing MTTR on a backend service covers the practices that pair with these tools.
What can these tools not fix?
These tools cannot diagnose a failure from evidence that no tool collected. Every diagnosis tool on this list reads data that was emitted before the incident started: metrics, spans, logs and exceptions. When the cause sits in a value the code never logged, such as a malformed field in one tenant's payload, each tool can narrow the search to a service or a function and then stop.
The usual next step is slow. An engineer adds a log line, opens a pull request, waits for review and a deploy, then waits for the failure to happen again. That loop sits inside the diagnosis phase and repeats for each wrong guess.
Three further risks apply across the list.
The first is mitigation without cause. A rollback or a disabled flag ends user impact, and the incident closes. The defect stays in the code until someone confirms the cause, and the same failure returns with the next release.
The second is confident AI output from partial data. Several tools on this list now propose a root cause. Ask each vendor to show an investigation that ended as inconclusive, and how the interface signals low confidence to a tired responder.
The third is tool sprawl. Ten tools mean ten integrations, ten permission models and more tabs during an incident. Each tool should remove a measured delay from a specific phase, or it adds to the delay it was bought to remove.
How do these tools fit your stack?
These tools fit together as layers, one per phase of the incident clock. The list below maps a common stack to the job each layer does.
- Datadog, Honeycomb or Grafana collect metrics, logs and traces and fire alerts.
- Sentry groups exceptions by release and stack trace.
- PagerDuty, incident.io or Rootly page the right person and run the response.
- LaunchDarkly or Argo Rollouts end user impact without a full redeploy.
- Statuspage keeps customers and internal teams informed.
- HyperProbe captures the live code-level evidence the other layers did not collect.
HyperProbe complements the tools on this list rather than replacing any of them. The full HyperProbe entry above covers what it captures and how probes stay read-only.
How should an SRE team choose?
Choose incident response tools by measuring phase durations first, then trialing tools against the slowest phase with real incidents. The table below lists each decision criterion and the evidence a trial should return.
| Criterion | Evidence to request |
|---|---|
| Phase impact | Phase durations from the last 10 incidents, and which phase the tool changes |
| Diagnosis quality | For two or three replayed incidents, the tool's top hypothesis, its sources and whether it matched the confirmed cause |
| Honest uncertainty | One investigation that ended as inconclusive, and how the interface showed it |
| Actions and approval | The list of actions the tool can take, and the approval rule for each |
| Audit trail | An export of every automated step for one incident, with sources and timestamps |
| Total cost | Seats, hosts, events, AI usage and add-ons at current scale and at 1.5 times current scale |
| Exit terms | Data export format and notice period in the contract |
Three patterns usually settle the shortlist. Teams with slow mobilization start with paging and escalation, then add coordination. Teams with frequent release-caused incidents get the largest gain from feature flags and automated rollback. Teams whose incidents stall after the first hypothesis need deeper evidence in the diagnosis phase, from high-cardinality telemetry, error tracking and live code-level capture.
Shorten the slowest phase first
Incident response tools reduce MTTR one phase at a time. Paging and coordination tools cut the minutes before work starts. Feature flags and rollbacks cut the minutes users feel. The diagnosis phase still waits on evidence from the running code, and that wait decides how long many incidents last.
When the investigation narrows the cause to a function and the logs stop short, HyperProbe captures what that line held in production. Book a HyperProbe walkthrough to see it on one of your own incidents, or visit the HyperProbe homepage for the product overview.
To start on your own, follow the quickstart guide and place a probe on a service in minutes.
Frequently asked questions
What are the best incident response tools for reducing MTTR?
The best incident response tools for reducing MTTR in 2026 are HyperProbe for live code-level diagnosis, PagerDuty, incident.io and Rootly for mobilization, Datadog, Honeycomb and Sentry for diagnosis, LaunchDarkly and Argo Rollouts for mitigation, and Atlassian Statuspage for communication. The right first purchase depends on which phase took longest across your last 10 incidents, not on a single overall ranking.
What is the difference between MTTR and failed deployment recovery time?
MTTR measures the average time to resolve any incident, including infrastructure and third-party failures. Failed deployment recovery time is the DORA metric that replaced MTTR in DORA's model in 2023, and it counts only failures caused by a deployment. A cloud provider outage counts toward incident MTTR but not toward the DORA metric, so teams that report both should keep them separate.
Should responders mitigate before finding the root cause?
Yes. Google's SRE guidance tells responders to stop the bleeding first and preserve evidence such as logs for later analysis. A rollback or a disabled feature flag ends user impact while the cause is still unknown. The root cause still needs confirmation afterward, because a mitigated defect stays in the code and can return with the next release.
Do AI features in incident response tools reduce MTTR?
AI features reduce MTTR when they shorten a measured phase, such as summarizing an incident or proposing a cause with cited sources. Every AI investigation reads data that tools already collected, so it cannot confirm a cause that sits in an unlogged value. Ask each vendor for an investigation that ended as inconclusive, and check how the interface shows low confidence.
How do you find which MTTR phase is slowest?
Pull timestamps from your last 10 incidents and split each one into detection, mobilization, diagnosis, mitigation and recovery. The paging tool holds alert and acknowledgement times, the incident timeline holds diagnosis notes, and the deploy log and flag audit log hold mitigation times. The phase with the largest total is where a new tool will save the most time.
How does HyperProbe fit with incident response tools?
HyperProbe is an AI on-call agent for live production debugging, built on dynamic instrumentation. It works in the diagnosis phase beside PagerDuty, Datadog, Sentry and similar tools. When logs and traces stop short, HyperProbe places a read-only probe on the suspect line and captures variable state. Read-only probes do not pause production, change source code or require a redeploy.
Written by
Founder
Shailendra Singh is the founder and CEO of HyperProbe (YC S26), an AI on-call agent that debugs production incidents by capturing evidence directly from running services. He has over a decade of experience building and running production systems, starting at Applied Materials before moving into startup operating and engineering leadership roles, including at a company that later became a unicorn. He founded and ran Transporter.city from 2017 to 2021, then spent three years building HyperTest before founding HyperProbe with Karan Raina. He writes about production debugging and incident response.
RELATED READS